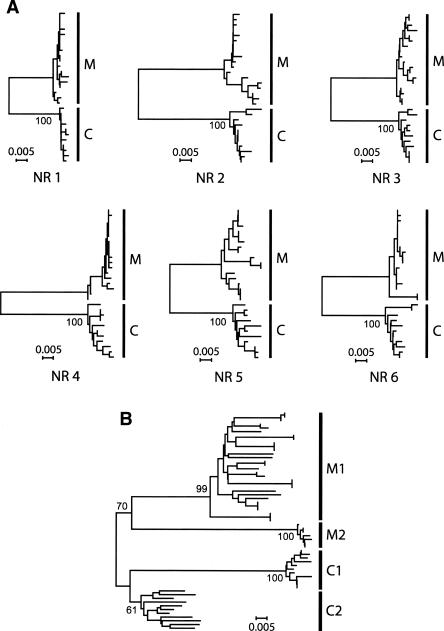
Figure 3.
Gene genealogies of allelic sequences at (A) the six neutral genomic regions and (B) the csd region 3 from A. mellifera and A. cerana. The neighbor-joining method with Kimura's two parameter distances is used. Bootstrap percentages (from 2000 replications) for major groups are shown on the internal branches. Major groups are labeled as follows:(M) A. mellifera, (C) A. cerana, (M1) A. mellifera type 1, (M2) A. mellifera type 2, (C1) A. cerana type 1, and (C2) A. cerana type 2. The same individuals are used for all seven gene trees. For easy comparison, the scale (in units of the number of nucleotide changes per site) is the same for all the trees. (NR 1–6) Neutral regions 1–6. For tree-making, 583 (for csd), 934 (NR 1), 785 (NR 2), 842 (NR 3), 770 (NR 4), 864 (NR 5), and 835 (NR 6) nucleotide sites are used.

