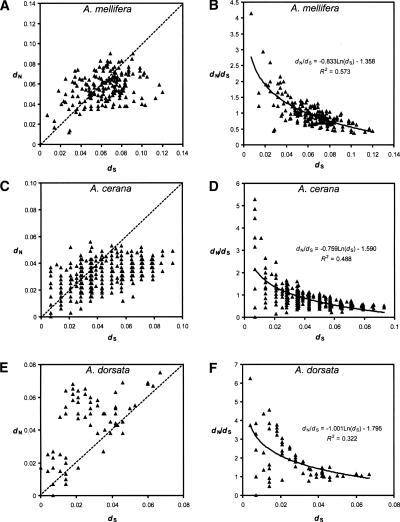
Figure 7.
Patterns of nucleotide changes in region 3 of csd. Synonymous (d S) and nonsynonymous (d N) nucleotide distances are shown for all pairs of csd alleles in (A) A. mellifera, (C) A. cerana, and (E) A. dorsata. Decline of d N/d S with d S is shown for (B) A. mellifera, (D) A. cerana, and (F) A. dorsata. In A. mellifera and A. cerana, only type 1 alleles were used in the analysis. Five data points in A. cerana and one in A. dorsata could not be plotted because their d S values are 0, making d N/d S infinite.

