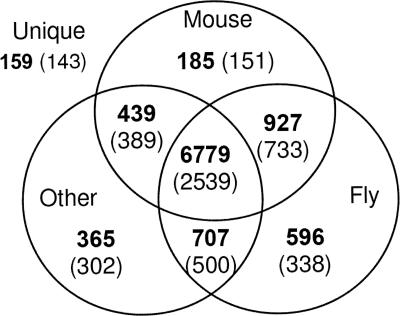
Figure 1.
Venn diagram describing the taxonomical distribution of 10,157 bee proteins and 5095 roots with respect to fly, mouse, and all other species. Bold numbers indicate the amount of proteins in each partition. Numbers in parentheses are numbers of roots. Note 159 proteins that were not clustered with proteins from other species and are thus labeled “unique.”

