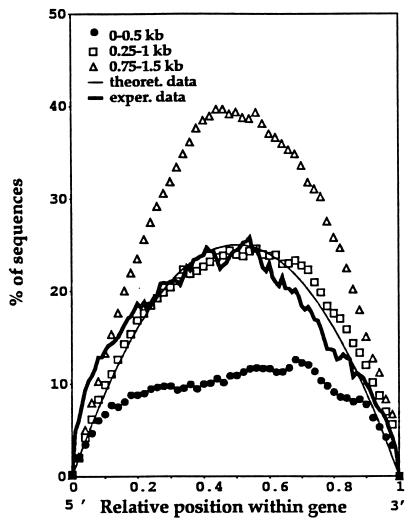
Figure 1.
The predicted, simulated, and experimentally determined position of ORESTES. The smooth, solid curve shows the predicted percentage of ORESTES that should contain the point, with the relative position shown within a hypothetical transcript. The curves described by the symbols indicated the coverage of known, full-length genes by ORESTES of different length generated by computational simulation. The irregular, solid line in bold shows the actual percentage of ORESTES that passed through the relative position of full-length cDNA sequences.

