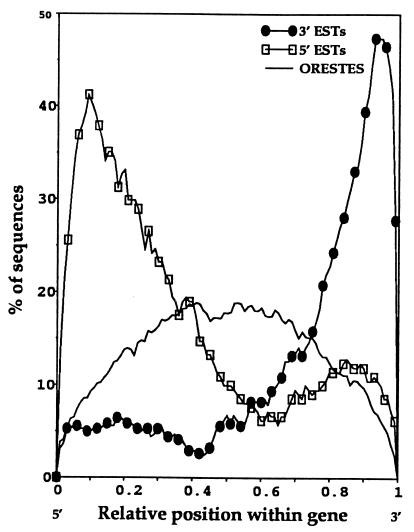
Figure 2.
A comparison of the actual percentage of ORESTES and 5′ and 3′ ESTs that pass through the relative position of full-length cDNA sequences. The figure was constructed by using all human full-length cDNAs of more than 1 kb currently in GenBank, the ORESTES corresponding to these cDNAs, as well as the 3′ and 5′ ESTs available in GenBank corresponding to these genes. With cDNAs of less than 1 kb, the 3′, 5′, and ORESTES reads are highly superimposed, making their relative contributions difficult to distinguish. Small cDNAs thus were not included in the figure.

