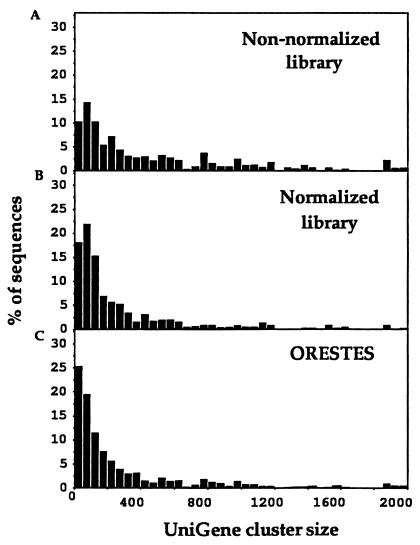
Figure 3.
Comparison of abundance of ORESTES and ESTs. (A) Nonnormalized breast tumor cDNA library NCI CGAP Br1.1. (B) Normalized breast tumor cDNA library NCI CGAP Br2. (C) ORESTES. The bars show the percentage of nonredundant sequences with similarity to full-length human cDNAs that matched UniGene clusters containing the number of ESTs shown.

