Figure 5.
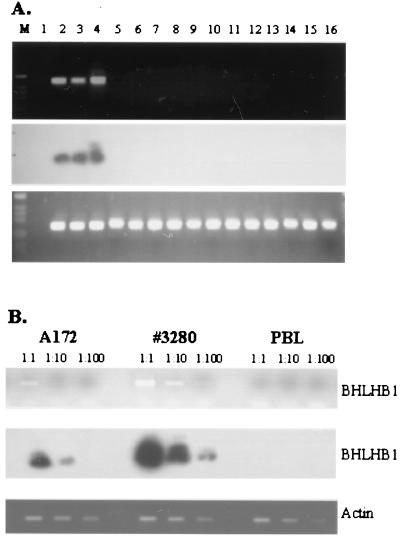
Expression of BHLHB1 in t(14;21) cells. (A) Total RNA was reverse-transcribed and PCR-amplified as described in Materials and Methods. (Top) BHLHB1 primers. (Bottom) Actin primers. (Middle) Hybridization of the gel shown in the Top panel to an internal BHLHB1 oligonucleotide. M, 1-kb ladder size standard; lane 1, dH2O; lanes 2 and 3, glioblastoma cell lines (A172 and U87, respectively); lane 4, t(14;21) leukemic cells; lanes 5–10, T-ALL cell lines (Molt4, HSB-2, CEM, Jurkat, DU528, and SUPT1, respectively); lanes 11 and 16, bone marrow from T-ALL patients without a t(14;21); lanes 12–14, bone marrow from acute myeloid leukemia patients without a t(14;21); lane 15, peripheral blood lymphocytes. A signal from faint bands in lanes 15 and 16 can be detected upon prolonged exposure of the autoradiogram (data not shown), suggesting low-level expression of BHLHB1 in these samples. (B) Serial dilutions of the A172, t(14;21) leukemic cells (#3280), and peripheral blood lymphocyte (PBL) cDNA were amplified to detect BHLHB1 (Upper) and actin (Lower) transcripts. The gel was blotted and hybridized to an internal BHLHB1 oligonucleotide as described above.

