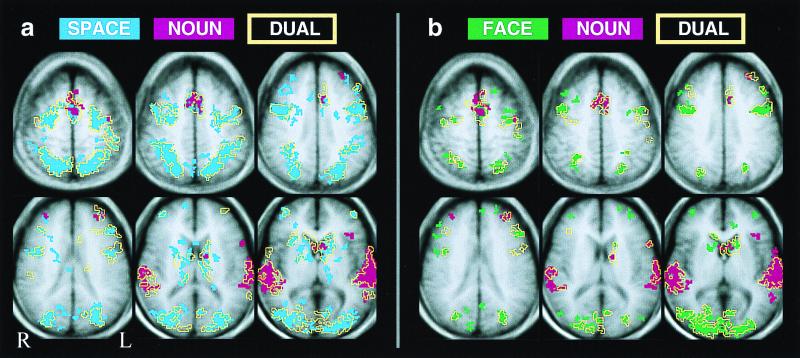
Figure 2.
Activation map overlays for composite data, showing anatomical relationship of dual-task activations (yellow outline masks) to component tasks (solid colors: red, NOUN; blue, SPACE; green, FACE). For clarity of display, maps are cluster-filtered at three contiguous voxels; however, the logical analysis used to identify activations attributable to CES function did not use a cluster filter. Changing thresholds changes size and scatter of activations but does not affect ratio of SINGLE/DUAL overlap of activations.

