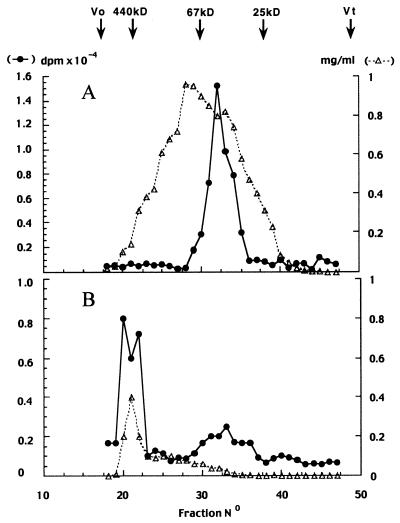
Figure 3.
Chromatography of Mono Q peaks (see Fig. 2) by FPLC on a Superose 12 gel-filtration column. Fractions A (4.5 mg of protein) and B (1.1 mg of protein) were deposited on the column and eluted with TEDGCP buffer, 0.4-ml fractions were collected, and saturable [3H]PREG binding was measured. The column was calibrated with molecular-mass markers. Distinct low and high molecular mass components corresponding to peaks A and B, respectively, were determined. ●, [3H]PREG bound in dpm; ▵, protein concentration in mg/ml.

