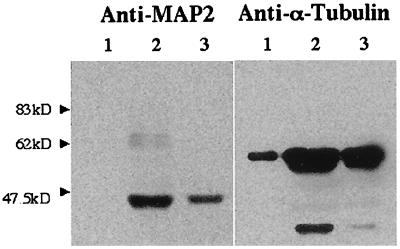
Figure 4.
Immunoblotting of cytosol and of peak-A fractions eluted from ion-exchange and gel-filtration columns. Lane 1, crude cytosol; lane 2, Mono Q fraction A; lane 3, fraction A rechromatographed on Superose 12. Protein (10 μg) was deposited in lanes 1 and 2. The amount of protein in lane 3 was below the limit of detection.

