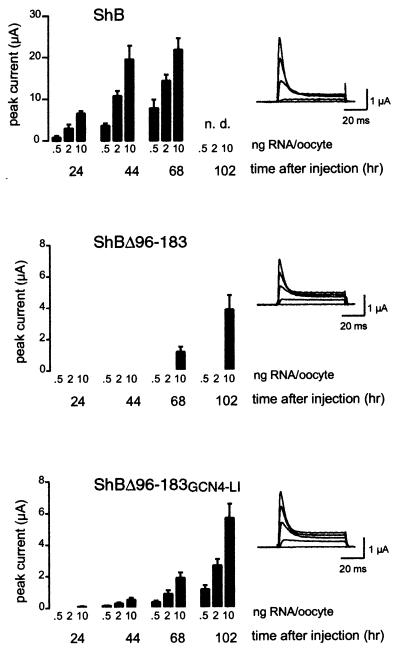
Figure 2.
Efficiency of channel formation determined by time course and RNA dose response of ShB, ShBΔ96–183, and ShBΔ96–183GCN4LI. Oocytes were injected with concentrations of RNA as indicated. Peak currents resulting from a depolarization from −80 mV to + 30 mV at different times after injection are plotted in graph. Data points reflect mean and SE for 3–5 oocytes. Leak-subtracted currents from two electrode voltage-clamp recordings were elicited by 100-ms depolarizing steps from a holding potential of −80 mV to −30, −10, 10, 30, and 50 mV in 2 mM K+.

