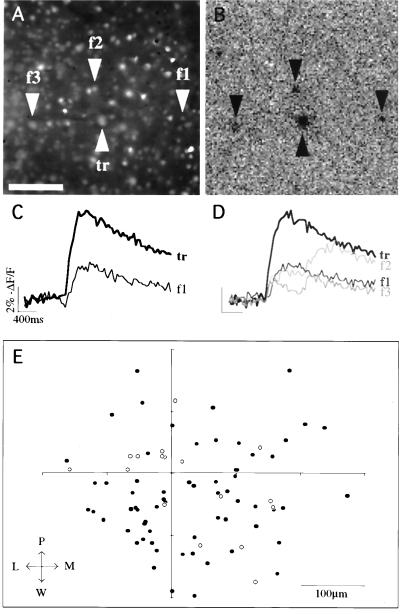
Figure 3.
Repeated activation and location of followers. (A) Fluorescence image of a slice from a P12 mouse showing the relative location of the trigger and three follower cells. The area imaged was a region of layer 5 with the pial surface to the upper left. The slice was maintained in Mg2+-free ACSF. (B) Localization of followers with the processed fluorescence movie (see text). At 840 ms into the imaging, depolarizing current pulses (0.8 nA; 5 msec; 40 Hz) were used to elicit a train of 10 APs in the trigger cell. In this frame of the processed movie, corresponding to the onset of the train, four darker regions can be noted at the somata of the trigger and three follower cells. (Scale bars = 100 μm.) (C) Fluorescence measurements from the soma of the trigger and follower 1. The onset of the calcium signal in the follower cell occurs within 40 msec of the onset in the trigger cell. (D) Fluorescence measurements from the next trial with identical stimulation. Follower 1 again produces a response. In addition, two other followers have calcium accumulations during the stimulation. (E) Positions of followers. Center of coordinates is the position of the trigger cell. Each circle represents the somatic position of a follower cell. Open circles are followers that were activated more than once. P, pial; W, white matter; L, lateral; M, medial.

