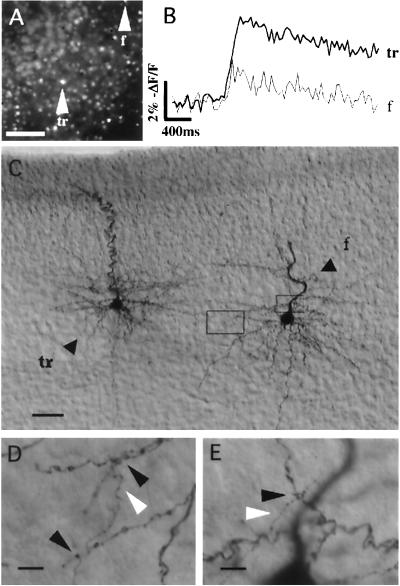
Figure 4.
Anatomical connection between trigger and follower neurons. (A) Fluorescence image of a slice from a P12 mouse showing the relative location of the trigger and follower cells. The area imaged was a region of layer 5 with the pial surface to the upper left. (Scale bar = 100 μm.) (B) Fluorescence measurements from the soma of the trigger and follower cells. (C) DIC photomicrograph of the two cells, after patching the follower and biocytin processing. Axonal and dendritic arbors from each cell can be distinguished. The two boxes show regions of contacts displayed in D and E. (Scale bar = 50 μm.) (D) Higher magnification of left box in C. Black arrows point at putative contacts between the axon (white arrow, vertical process) of the trigger cell and a dendrite of the follower. (E) Higher magnification of the right box in C. An additional contact can be seen. (Scale bar = 10 μm.)

