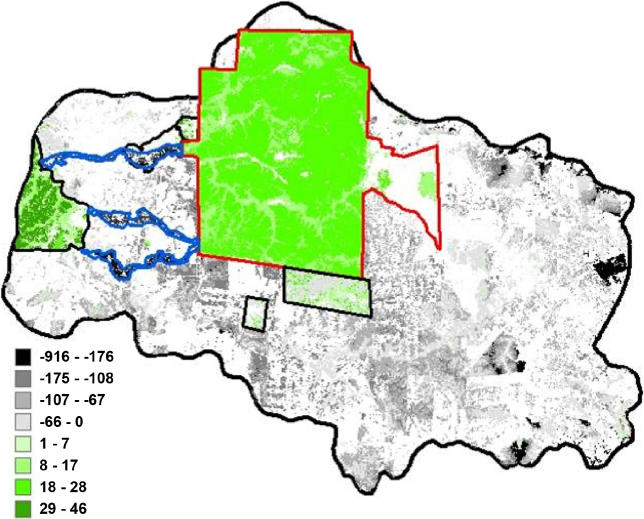
Figure 4. Differences between Economic Costs and Benefits of Conservation across the Mbaracyau Forest Biosphere Reserve.
Green represents areas where economic benefits exceed costs (both as net present values in US$ per hectare), based on bushmeat + timber + bioprospecting values. Gray/black areas are where costs exceed benefits. Darker shading indicates greater deviation from zero in either direction. Three potential corridors connecting the core protected area and the large indigenous reserve to the west are outlined in blue.

