Abstract
A finite element (FE) model has been developed based upon the recently measured micro-scale morphological, chemical and mechanical properties of dentin–adhesive (d–a) interfaces using confocal Raman microspectroscopy and scanning acoustic microscopy (SAM). The results computed from this FE model indicated that the stress distributions and concentrations are affected by the micro-scale elastic properties of various phases composing the d–a interface. However, these computations were performed assuming isotropic material properties for the d–a interface. The d–a interface components, such as the peritubular and intertubular dentin, the partially demineralized dentin and the so-called ‘hybrid layer’ adhesive-collagen composite, are probably anisotropic. In this paper, the FE model is extended to account for the probable anisotropic properties of these d–a interface phases. A parametric study is performed to study the effect of anisotropy on the micromechanical stress distributions in the hybrid layer and the peritubular dentin phases of the d–a interface. It is found that the anisotropy of the phases affects the region and extent of stress concentration as well as the location of the maximum stress concentrations. Thus, the anisotropy of the phases could effect the probable location of failure initiation, whether in the peritubular region or in the hybrid layer.
Keywords: anisotropy, micromechanics, dentin–adhesive interface, finite element analysis, stress distributions
1. Introduction
The micromechanical behaviour of the dentin–adhesive (d–a) interface can provide insight to the bonding and failure mechanisms associated with dental restorations using composites. Current adhesives attach to dentin via a hybrid layer (HL) (see Nakabayashi & Saimi 1996; Nakabayashi & Pashley 1998). The ideal HL is formed when adhesive resin penetrates the demineralized dentin, infiltrating the exposed collagen to create a continuous integrated collagen/resin biopolymer that bonds the bulk adhesive to the intact dentin (Gwinett 1993; Tam & Pilliar 1994; Inokoshi et al. 1996; Eick et al. 1997). The collagen fibres of the demineralized dentin are expected to be enclosed in adhesive resin and are thus protected from the hydrolytic action of oral or dentinal fluids. However, demineralized dentin is 30% collagen and 70% water, and the adhesive must diffuse through water to form the HL (Nakabayashi & Pashley 1998). Frequently, the hybrid zone consists of a complex composite structure with morphology and properties that are highly sensitive to both the demineralization process and specific characteristics of the bonding adhesive system. For instance, the BisGMA/HEMA adhesive system undergoes physical separation upon mixing with water in the demineralized dentin, leading to partitioning of the adhesive into hydrophobic BisGMA- and hydrophilic HEMA-rich phases (Spencer & Wang 2002). The critical dimethacrylate (BisGMA), the component that contributes most to the cross-linked polymeric adhesive, is found to infiltrate only a fraction of the wet, demineralized intertubular dentin, and nearly half of the interface remains predominantly collagen with contribution from the hydrolytically unstable monomethacrylate HEMA. Because of its low cross-link density, HEMA is unstable in aqueous environments, and this phase will thus degrade when exposed to oral fluids. The objective of encapsulating the exposed collagen fibers of the demineralized dentin is not always achieved and the zone of demineralized dentin/exposed collagen is not completely infiltrated by adhesive resin.
In recent years, finite element (FE) models have been developed to understand the potential influence of imperfect HL upon the mechanical performance of the d–a interface (e.g. Lee et al. 2001). These FE models have been utilised to obtain the micromechanical stress distributions within the d–a interfaces. Based upon recently measured micro-scale morphological, chemical and mechanical properties of d–a interfaces, the authors have developed an FE model (Misra et al. 2004). In this model, confocal Raman microspectroscopy has been utilised to characterize the micro-scale morphology and composition, while scanning acoustic microscopy (SAM) has been utilised to measure the micro-scale elastic moduli of d–a interfaces. The results computed from the FE model indicate that the stress distributions and concentrations are affected by the micro-scale elastic properties of various phases composing the d–a interface. However, these computations were performed assuming isotropic material properties for the d–a interface. The dentin has long been regarded as an anisotropic material and recent measurements provide further evidence of the anisotropic nature of dentin (Kinney et al. 2003). Moreover, other d–a interface components, such as the partially demineralized dentin and the HL adhesive-collagen composite, are probably anisotropic as well. In this paper, a revised FE model is developed to more accurately represent the morphological and micromechanical data. The revised model is utilised to investigate the effect of dentin and the HL anisotropy on load transfer at the d–a interface. To gain insight into the relative influence of material anisotropy, and to keep the post-processing of the computational results, tractable two-dimensional FE models are considered. The FE models are designed to investigate micromechanical measures for two sections of d–a interface—one along the axis of the tubules, and the other transverse to the axis of the tubules. The FE model of the d–a interface section along the tubules is utilised to investigate the effect of HL and dentin anisotropy. FE models of two different transverse sections are considered—one through the HL to study the effect of HL anisotropy, and the other through the dentin to study the effect of dentin anisotropy. These models are utilised to perform parametric studies of the effect of anisotropy on the stress and strain distributions within the dentin and the HL phases of the d–a interface.
1.1 Dentin–adhesive interface idealization for FE modelling
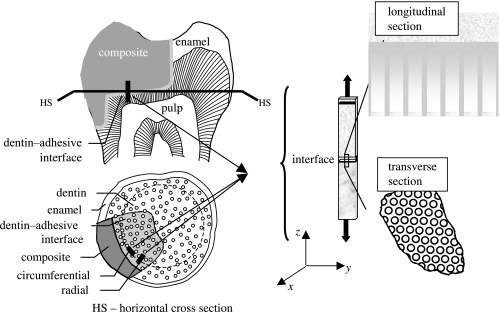
Raman microspectroscopy (μRS) has been utilized in the past to detect and quantify the molecular chemistry of d–a interface samples (Wieliczka et al. 1996, 1997; Lemor et al. 1999; Spencer et al. 2000; Wang & Spencer 2002). In a recent paper by Wang & Spencer (2002), μRS data have been utilized to develop a method to determine the molecular-level composition of the dentin adhesive-HL interface, and to quantify the diffusion of adhesives into the demineralized dentin. In addition, using SAM, the in situ micromechanical properties of the d–a interface components have been determined (Katz et al. 2001, 2002, 2003). Because of the non-destructive, non-invasive nature of the μRS and SAM, the same specimens have been investigated with both these techniques. As a result, the micro-scale morphology, chemical composition and the elastic property of the same small regions of the d–a interface of several specimens have been determined (e.g. table 3 of Katz et al. 2003). This micro-scale data was utilized to develop a two-dimensional FE model for analysing micromechanical stress distributions in the d–a interface (Misra et al. 2004). In this paper, the FE model is extended to more accurately represent the morphology and the probable anisotropic properties of the d–a interface components by considering a parametric variation of anisotropy of elastic moduli of the HL and the dentin. In general, multi-axial stresses will develop at the d–a interface when a restored tooth is subjected to loading. To keep the analysis simple, we consider the cases of uniaxial tensile loading (i) along the axis of the tubules, and (ii) transverse to the axis of the tubules, as depicted in figure 1. In this paper, the sample along the tubule direction is termed as the longitudinal section, and the sample perpendicular to the tubule is termed as the transverse section.
Figure 1.
Thin rectangular sample of restored tooth subjected to tensile loading.
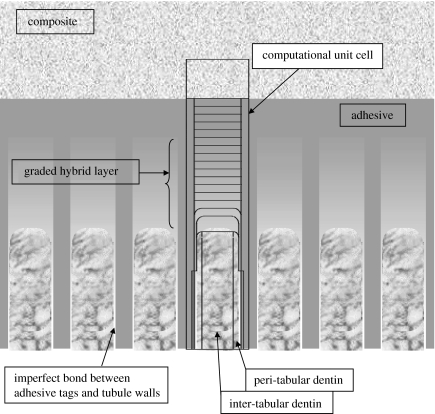
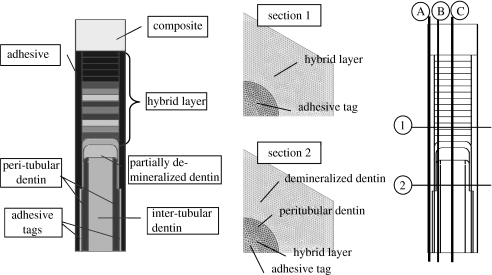
Based upon the microchemical, micromechanical and morphologic characterization using μRS, SAM and optical microscopy, the d–a interface geometry may be represented by figure 2 representing the micro-scale longitudinal section. The longitudinal section of d–a interface is considered to be composed of the dental composite, the adhesive layer, the HL or the adhesive-collagen composite, uninfiltrated demineralized dentin or exposed collagen, uninfiltrated partially demineralized dentin, and the peritubular and intertubular dentin. Among the important features of the d–a interface are the adhesive flows into the tubule orifice forming adhesive tags that may be imperfectly bonded to the lumen wall through HLs. Furthermore, the microchemical measurements have shown that the adhesive infiltration into the demineralized dentin diminishes with depth, such that the adhesive–collagen HL is graded with depth (Wang & Spencer 2002, 2004). The amount of infiltration and the thickness of the HL is typically a function of the adhesive type. In addition, in the cases where the adhesive infiltration is not to the full depth of the demineralized dentin, an exposed collagen layer may exist below the HL as observed by Katz et al. (2001) through SAM measurements. Moreover, based upon the μRS measurements, the dentin underlying the HL has been found to be partially demineralized in a graded manner down to the dentin substrate (Wang & Spencer 2002). In addition, SAM measurements have shown that the dentin below the exposed collagen zone may also experience partial demineralization, such that close to the interface, the dentin may be considered as mechanically graded. Thus, the d–a interface is characterized by a unique microstructure and a graded micromechanical property. Based upon the idealized d–a interface described above, a computational unit cell, which is representative of the interface section, is identified as depicted in figure 2. The distributions of micromechanical measures within the longitudinal section of the d–a are analysed by considering the two-dimensional FE models of this unit cell. The FE models were created and analysed using a widely utilized commercial FE package I-Deas.
Figure 2.
Schematic of the longitudinal section of dentin–adhesive interface.
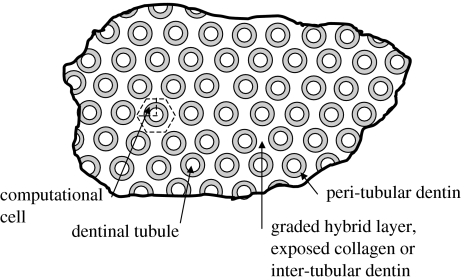
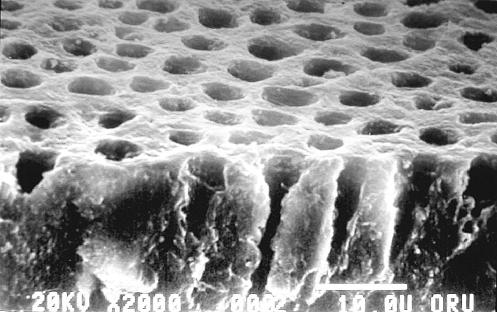
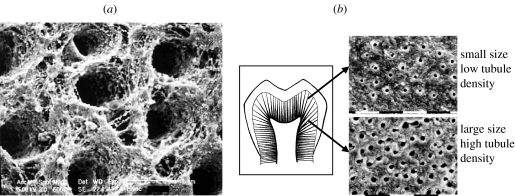
The micro-scale geometry of the transverse section may be similarly idealized based upon the microchemical, micromechanical and morphologic characterizations. Figure 3 represents the micro-scale transverse section of d–a interface. It is well known that the spacing between dentinal tubules is a function of the distance from the pulpal cavity towards the outer tooth surface. The spatial arrangement of the tubules is considered to be random with some degree of order (Kinney et al. 2001). From a visual inspection of the SEM micrograph shown in figure 4, it is reasonable to assume that the tubules are arranged in a near hexagonal lattice. Therefore, for the purposes of the FE model, a perfect hexagonal arrangement is assumed such that a two-dimensional hexagonal unit cell may be utilized to represent the transverse section. Furthermore, for computational efficiency, the symmetry of the two-dimensional unit cell may be exploited to select a computational cell shown in figure 3, which is a quarter of the hexagonal unit cell (Achenbach & Zhu 1990). The distributions of micromechanical measures within the transverse section of the d–a are analysed by considering the two-dimensional FE models of this computational unit cell.
Figure 3.
Schematic of the transverse section of dentin–adhesive interface.
Figure 4.
SEM micrograph showing the spatial distribution of dentin tubules.
2. Materials and methods
2.1 FE models of longitudinal and transverse sections
Plane stress or axisymmetric elements may be utilized in the analysis to mimic the uniaxial tensile loading of the longitudinal section, depending upon the orientation of the section. The sections oriented in the circumferential plane are expected to be under a plane stress condition, while those oriented in the radial plane are expected to experience axisymmetric loading conditions. For the circumferential section, plane stress elements are considered appropriate in all d–a interface components as out-of-plane stress may be shown to have a minimal influence on the stress distributions (Misra et al. 2004). For the radial section, axisymmetric elements may be utilized for all d–a interface components. Qualitatively identical results are obtained for analysis of the longitudinal section under plane stress and axisymmetric conditions. In contrast, the transverse section may be modelled using either plane stress or plane strain elements. Again, qualitatively similar results are utilized from analysis under plane stress or plane strain conditions. Elastic stress analyses of the two-dimensional computational unit cells subjected to tensile loads were performed with a widely utilized commercial FE package I-Deas. The FE meshes for these analyses are shown in figure 5.
Figure 5.
Longitudinal section and the two transverse section FEM mesh and sections along which the stress/strains show maximum concentrations.
Based upon the geometrical properties of the interface components, the computational unit-cell sizes for the longitudinal section may range from 30 to 37.0 μm high and 5.2–9.0 μm wide depending upon the location of the d–a interface in reference to the distance from pulpal cavity. The restorative dental composite is taken to be 6.0 μm thick, the adhesive layer to be 5.0 μm thick (it could be as thick as 15.0 μm) and the adhesive tags to be 2.0 μm wide. The partially demineralized intertubular dentin is taken to be 2.0 μm thick. The width of the peritubular dentin may vary from 0.6 to 1.0 μm, while that of the intertubular region may vary from 2.0 to 5.0 μm. Furthermore, the thickness of the HL is varied from 2.0 to 10.0 μm. The length of the HL formed between the adhesive tag and lumen wall is assumed to be between 5 and 7 μm along the tubule. The computational unit cell sizes for the transverse section are determined by the dentinal tubule centre-to-centre distance, which may range from 5.2 to 9.0 μm, depending upon the location of the d–a interface in reference to the distance from pulpal cavity. Perfect bonding is assumed among the various d–a interface phases. For accuracy of calculations, element size is chosen to be 0.1 μm.
2.2 Boundary conditions for the FE models
For the longitudinal section oriented in the circumferential plane (plane stress condition), the periodicity of the computational cell in the horizontal direction is considered by applying periodic boundary conditions on the nodes along the boundaries in the horizontal direction, given by
| (2.1) |
where u and v are the nodal displacements along x and y directions, respectively, and B is the width of the unit cell. For the longitudinal section oriented in the radial plane (axisymmetric condition), the horizontal boundaries are restrained as follows:
| (2.2) |
The bottom boundary nodes of the peritubular and intertubular dentin are restrained in the vertical directions. The bottom boundary nodes of the adhesives tags are unconstrained, as these are not attached at their base. A tensile force equivalent to 20 MPa is applied on the top boundary nodes of the dental composite. This applied stress is chosen to investigate the stress distributions close to the tensile strength of d–a interfaces. We note that Phrukkanon et al. (1999) have reported that the d–a interface tensile strength ranges from 15 to 30 MPa, depending upon dentin position.
For the transverse section, due to the nature of periodicity, strain controlled loading is considered appropriate for the analysis. Therefore, displacements that are compatible with the overall average strain of the transverse section are applied on the nodes of the hexagonal faces of the computational unit cell as follows:
| (2.3) |
where X and Y are the coordinates of the boundary nodes, and ϵij is the two-dimensional strain tensor. In addition, the vertical displacements are restrained on the horizontal symmetry boundary, while the horizontal displacements are restrained on the vertical symmetry boundary. Two loading conditions are considered in the transverse section analyses, (i) uniaxial loading in the x-direction termed as X-loading such that ϵxx=0.001 and the other strain components are zero, and (ii) uniaxial loading in the y-direction termed as Y-loading such that ϵyy=0.001 and the other strain components are zero. These strains approximately correspond to the transverse strain experienced by the longitudinal section under the loading described in the previous paragraph.
2.3 Elastic properties and transverse isotropy parameters for dentin–adhesive interface phases
Beginning in the 1960s, macro-scale elastic moduli of dentin have been measured by a variety of methods as reviewed by Kinney et al. (2003). However, relatively few attempts have been made to measure the elastic moduli at micro and sub-micro scales. Table 1 shows the elastic and geometrical properties of the interface components based upon published values measured using micromechanical methods. Using nanoindentation methods, Kinney et al. (1999), have measured the elasticity modulus of peritubular dentin to have a mean value of 28.6 GPa, with that of intertubular dentin as having a mean value of 20.0 GPa. More recent measurements by Katz et al. (2001) using SAM have shown that in the vicinity of the interface, the intertubular dentin may have elasticity modulus as low as 13.0 GPa due to partial demineralization. Thus, the intertubular dentin below the hybrid/exposed collagen layer is expected to have a modulus gradient from 13.0 GPa ramping up to 20.0 GPa. Using SAM, Katz et al. (2001) have also measured the elastic modulus of the exposed collagen layer to be 1.76 GPa. It is noted that the HL modulus depends upon the success and extent of adhesive infiltration into the demineralized collagen. For a given adhesive infiltration profile, the HL modulus may be graded between a high of 5.0 GPa for adhesive and ca 1.0 GPa for exposed collagen depending upon the volume fraction of adhesive-collagen mixture. In this paper, by assuming a linear adhesive infiltration profile, the elastic modulus of the HL is taken to be graded from 4.0 GPa at the top of the HL to 1.76 GPa in the exposed collagen layer at the bottom of the HL.
Table 1.
Elastic and geometrical properties of the dentin–adhesive interface phases.
| interface phases | elastic modulus (GPa) | thickness (μm) |
|---|---|---|
| composite | ca 30 | |
| adhesive | ca 5 | 2–5 |
| peritubular dentina | 26–30 | 0.6–1 |
| intertubular dentinb | 20 | 2–5 |
| partially demineralized dentinc | 13 | variable |
| graded hybrid layerd | 4–2 | 2–10 |
| exposed collagend | <2 | variable |
Based upon measurements by Kinney et al. (1999).
Based upon measurements by Kinney et al. (1999) and Katz et al. (2001). The intertubular dentin modulus was measured to be 20 GPa by Kinney et al. (1999).
Katz et al. (2001) found that the intertubular dentin close to the interface has a lower modulus of 13 GPa due to partial demineralization during etching. Therefore, in the vicinity of the interface, the intertubular dentin is considered to have a modulus gradient from 13 GPa ramping up to 20 GPa.
Based upon measurements by Katz et al. (2003).
Very few measurements have revealed the nature of dentin elastic moduli anisotropy. In a recent paper, Kinney et al. (2003) have discussed dentin anisotropy in the context of elastic moduli measured using ultrasonic wave propagation techniques. Dentin elastic moduli obtained from longitudinal and shear wave velocity measurements by Lees & Rollins (1972) indicate that dentin is transversely isotropic with higher stiffness in the tubule direction. The elastic moduli measured by Kinney et al. (2004) using resonant ultrasound spectroscopy also indicate that the dentin is transversely isotropic, however, with higher stiffness perpendicular to the tubule direction. These measurements have been performed on millimetre scale samples. To date, the anisotropy of the micro-scale (at length-scales<1 μm) elastic moduli of the different d–a interface phases have not been measured experimentally. However, morphological features, such as the orientation of the collagen fibrils in the peritubular and intertubular dentin, as indicated by the SEM micrograph in figure 6a and the anisotropic nature of the hydroxyapatite crystals (Katz & Ukrainick 1971) strongly suggest that at micro and sub-micro scales the mechanical properties are probably anisotropic. In addition, the relative dense packing of collagen fibrils in the intertubular (as opposed to the peritubular) regions further suggests that the nature of anisotropy is probably different in the various regions of the dentin. However, we note that upon the basis of this limited morphological information, the nature or degree of anisotropy is difficult to predict. In any case, at the very minimum, the micro-scale elastic moduli of dentin may be considered to be transversely isotropic.
Figure 6.
SEM micrographs of partially demineralized dentin: (a) indicating the orientations of intertubular collagen fibrils; and (b) indicating that tubule opening is larger and spacing is denser for deep dentin as opposed to shallow dentin. As is evident, the structure and properties of dentin substrate vary with location and can affect the bond formation (Marshall et al. 1997).
In the absence of any directly measured micro-scale anisotropy of d–a interface phases, we consider that the HL and the peritubular dentin have transverse isotropic properties such that the stiffness in the longitudinal direction along the tubules (in the z-direction depicted in figure 1) is different than that in the transverse direction perpendicular to the tubules, given by the x–y plane depicted in figure 1. The transverse isotropic properties may be represented either in terms of the stiffness matrix Cij or the compliance matrix Sij that gives the relationship between the stresses and strains (see appendix A showing the stress–strain relationship for transversely isotropic elastic materials).
The stiffness matrix Cij and the compliance matrix Sij may be expressed in terms of the elastic modulus in the z-direction Ezz, the elastic modulus in the plane of isotropy Exx=Eyy=E, the Poisson's ratio associated with any two orthogonal directions in the x–y plane, νxy=νyx=ν, the Poisson's ratio associated with the z-direction and a direction in the x–y plane is, νxz=νyz=ν3, and the shear modulus Gzx=Gyz=G3. We note that the shear modulus in the x–y plane is given by
| (2.4) |
For simplicity of the FE analysis in this paper, we assume that the elastic modulus E=αEzz, the shear modulus G3=αGxy, and the Poisson's ratios ν3=ν, where the elastic moduli Ezz for different phases are taken as those given in table 1. The Poisson's ratio ν, is taken to be 0.29 for all the phases with the exception of exposed collagen. Considering that the exposed collagen layer may have high water content, its Poisson's ratio is taken to be 0.45. We note that the Poisson's ratio of the HL may also be graded from high water content exposed collagen value of 0.45–0.3 for dry dentin. The parameter α<1 yields transverse isotropic properties stiffer in the z-direction, α=1 yields isotropic properties, and α>1 gives transverse isotropic properties stiffer in the x–y plane. For our parametric study, the parameter α is taken to be 0.5, 1 and 2, in order to bound the probable anisotropy of the different phases.
3. Results
Micro-scale stress and strain distributions are obtained for both the longitudinal and transverse FE models by considering the above anisotropic elastic moduli. In the results we present in this paper, the longitudinal model is taken to be 37 μm high and 8.0 μm wide. The width of the peritubular dentin for this model is taken to be 1 μm and the HL thickness is taken to be 10 μm. The HL is considered to possess a linearly graded elastic modulus. In the FE model, the HL is divided into several sub-layers, and the sub-layer Ezz is varied linearly from 4 GPa in the proximity of adhesive layer to the exposed collagen elastic modulus of 1.76 GPa reported in the literature (Katz et al. 2003). The transverse model dimensions are related to the tubule centre-to-centre distance, which is taken to be 8.0 μm. In the transverse model, the adhesive tag is taken to be 1 μm in sections 1 and 2, while the peritubular dentin thickness is taken to be 0.6 μm in section 2 (see figure 5).
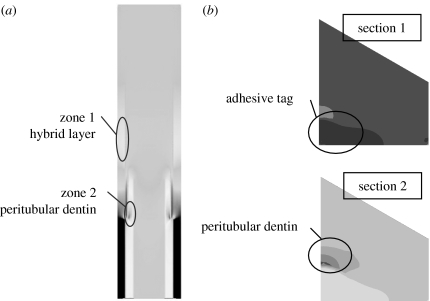
We focus upon the micro-scale stress and strain distributions within the HL and the dentin. These regions are chosen because these phases are considered critical to the behaviour of d–a interface. Stresses have been shown to concentrate in the HL and peritubular dentin (Misra et al. 2004). As shown in figure 7a, the stresses concentrate in two zones of the longitudinal section, where zone 1 is in the adhesive tags proximal to the HL, and zone 2 is in the peritubular dentin proximal to the adhesive tags at the base of the HL. In addition, as shown in figure 7b, the stresses concentrate in the adhesive tags proximal to the HL in the transverse section 1 and in the peritubular dentin proximal to the adhesive tags in the transverse section 2. In addition, it is well known that the HL has a relatively lower elastic modulus than the other phases and therefore may experience high strains.
Figure 7.
Stress concentration zones in (a) the longitudinal section; and (b) the two transverse sections.
3.1 Effect of anisotropy on the stress–strain distributions in the longitudinal section
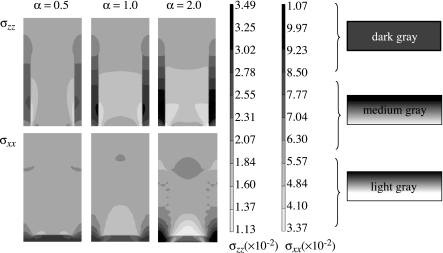
To investigate the effect of anisotropy, FE computations are performed for the longitudinal model by assigning anisotropic properties to the HL and the dentin while all the other phases are assigned isotropic properties. Figure 8 shows the longitudinal stress, σxx, and the transverse stress, σxx, distributions within the HL of the longitudinal section for anisotropy parameter α=0.5, 1 and 2. For the stress distributions in figure 8, only the HL is taken to be anisotropic, while the other phases are considered to be isotropic. The scales utilized for plotting each of these distributions are also shown in figure 8. As discussed above, the stresses concentrate in the adhesive tags in the vicinity of the HL.
Figure 8.
Effect of hybrid layer anisotropy on the longitudinal and transverse stress distribution in the hybrid layer (zone 1) of the longitudinal section.
Comparing the stress distributions for the longitudinal stress, σxx, in figure 8, we observe that for α=0.5, the case in which HL is stiffer in the tubule direction, the adhesive tag experiences a relatively lower stress concentration as shown by the smaller area of dark grey shading and the HL experiences less stress shielding as shown by the larger medium grey region compared with the isotropic case of α=1.0. In contrast, for α=2.0, the case in which HL is stiffer in the direction perpendicular to the tubule direction, the adhesive tag experiences a relatively higher stress concentration as shown by the larger area of dark grey shading and the HL experiences greater stress shielding as shown by the larger light grey region compared with the isotropic case of α=1.0. Similar behaviour is observed for the distribution of transverse stress, σxx.
The longitudinal stress, σxx, in the adhesive tag proximal to the HL may be as high as 34.9 MPa, which is 1.75 times the applied tensile stress of 20 MPa. In addition, the transverse stress, σxx, developed in the adhesive tag could be as high as 10.7 MPa. A majority of the HL experiences stress shielding, although in the upper region close to the adhesive layer the stresses could be close to the applied stress. Furthermore, the stress concentration in the adhesive tag proximal to the HL is less for HL that is stiffer in the tubule or the z-direction (α=0.5). Also, the transverse stress, σxx, concentration is located close to the partially demineralized layer as opposed to the z-direction stress concentration.
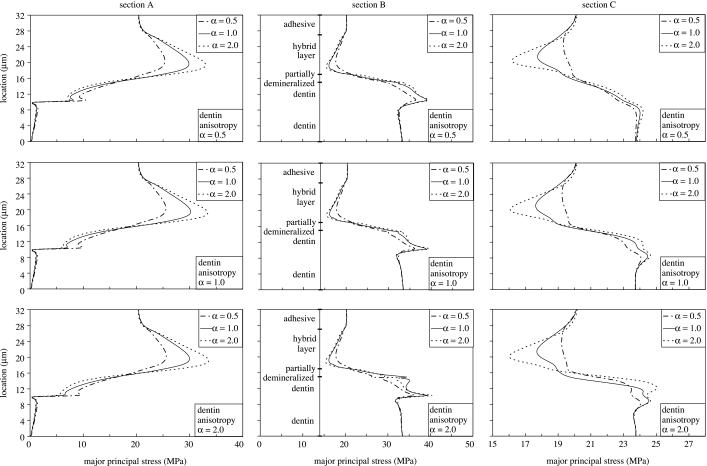
To further explore the details of stress distributions in the longitudinal section of the d–a interface, figure 9 plots the major principal stresses along sections A, B and C for anisotropy parameter α=0.5, 1 and 2. As noted from figure 5, section A goes through the adhesive tag, section B goes through the HL, the partially demineralized dentin and the peritubular dentin, and section C goes through the HL, the partially demineralized dentin and the intertubular dentin. In figure 9, the HL and the peritubular dentin are taken to be anisotropic, while the other phases are considered to be isotropic.
Figure 9.
Effect of hybrid layer and peritubular dentin anisotropy on the principal stress distributions in the longitudinal section.
From the plots for section A, we observe that the HL anisotropy has a considerable effect on the major principal stress concentration in the adhesive tag proximal to the HL. The maximum stress in this stress concentration region is typically located close to the bottom of the HL. As the anisotropy parameter for the HL changes from α=0.5 to 2.0, the maximum stress increases and the location of the maximum stress shifts closer to the bottom of the HL. The maximum stress varies from 25 MPa for α=0.5 to 35 MPa for α=2.0; thus, the stress concentration factor in the adhesive tags can be as high as 1.75. We also find that as the peritubular dentin anisotropy parameter changes from α=0.5 to 2.0, the maximum stress increases; however, this increase is small compared with that due to HL anisotropy.
For section B, we observe that the major principal stress increases from 20 MPa to 30 MPa in the partially demineralized dentin, and from 30 MPa to 40 MPa in the peritubular dentin. Thus, the partially demineralized dentin and the peritubular dentin can have stress concentration factors as high as 1.5 and 2, respectively. Although the HL anisotropy has only a small effect on the major principal stress concentration in the peritubular dentin, the stresses tend to be higher for isotropic HL and anisotropic peritubular dentin that is stiffer in the direction perpendicular to the tubule (α=2.0).
For section C, we observe that the HL experiences some stress shielding; however, the major principal stress in the top and bottom layers is close to the applied stress. The HL anisotropy has a small affect on the degree of stress shielding. For HL stiffer in the direction perpendicular to the tubule (α=2.0), the stress shielding is higher. We also find that the intertubular dentin experiences a stress concentration which is highest for HL and peritubular dentin stiffer in the direction perpendicular to the tubule (α=2.0). The HL anisotropy has a larger effect on the stress shielding within the HL, while the peritubular dentin anisotropy has a larger effect on the stress concentration in the intertubular dentin.
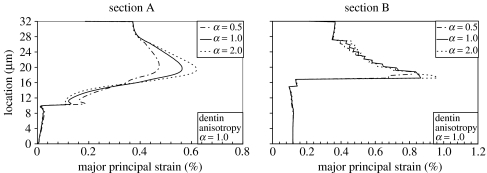
The strain distributions are very similar to the stress distributions. However, due to its lower elastic moduli, the HL experiences higher strains that typically exceed those of the neighbouring adhesive tag. As shown in figure 10, the maximum major principal strain ranges from 0.47 to 0.62% in the adhesive tag, while that in the HL ranges from 0.81 to 0.93% as the HL anisotropy changes from α=0.5 to 2.0. The highest strains are observed in the bottom zone of the HL for the HL that is stiffer in the direction perpendicular to the tubule (α=2.0).
Figure 10.
Effect of hybrid layer anisotropy on the strain distributions in the longitudinal section.
The stress and strain distributions computed using the longitudinal FE model indicate that failure or fracture could probably initiate at three locations in the HL and the dentin: (i) in the adhesive tag proximal to the HL due to stress concentration; (ii) close to the bottom of HL due to high strains; and (iii) interface between the adhesive tag and peritubular dentin of the lumen wall due to stress concentrations.
3.2 Effect of anisotropy on the stress–strain distributions in the transverse section
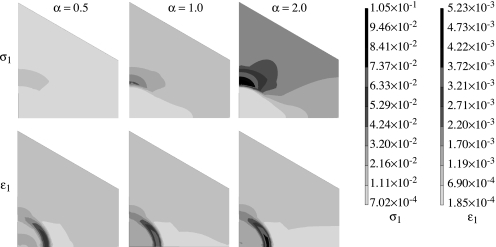
We focus upon the micro-scale stress and strain distributions in the adhesive tags proximal to the HL in the transverse section 1 and in the peritubular dentin proximal to the adhesive tags in the transverse section 2. Figure 11 shows the major principal stress and strain distributions within the transverse section 2, subjected to strain controlled loading in the x-direction for three cases of peritubular dentin anisotropy while the HL is isotropic. The scales utilized for plotting these distributions are also shown in figure 11. Qualitatively, similar distributions are obtained for loading in the y-direction.
Figure 11.
Effect of dentin anisotropy on the principal stress and strain distribution in the transverse section 2 with the hybrid layer kept isotropic.
As expected, the stresses concentrate in the peritubular dentin, and, interestingly, the maximum major principal stress is located in the peritubular region that is on the farther side of the tubule circumference as compared with the loading direction. Furthermore, the peritubular dentin anisotropy has a profound effect on the distribution as well as the concentration of stresses. As the peritubular dentin anisotropy changes from α=0.5 to 2.0 as the stress concentration in the peritubular and intertubular dentin increases. When the peritubular dentin is stiffer in the direction perpendicular to the tubule, the stress concentrations developed within the peritubular dentin could be up to 5–10 times that for the case in which the peritubular dentin is stiffer along the tubule. Furthermore, when the peritubular dentin is stiffer in the direction perpendicular to the tubule, the intertubular dentin experiences much higher stresses.
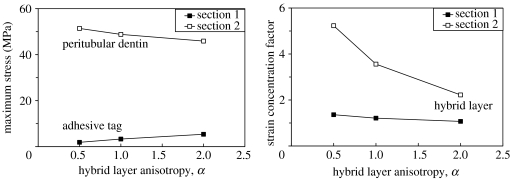
On the other hand, the principal strains tend to concentrate within the HL formed between the adhesive tag and the peritubular dentin of the lumen wall as shown in figure 11. This strain concentration is expected because the HL is a softer phase compared with the other phases in this section. However, it is interesting that this strain concentration is significantly affected by the peritubular dentin anisotropy. The strain concentration factor is 3.0 for α=0.5, 3.6 for α=1.0 and 5.2 for α=2.0. We note that when the peritubular dentin is stiffer in the direction perpendicular to the tubule (α=2.0), the strain concentrations developed within the HL could be up to 1.7 times that for the case in which the peritubular dentin is stiffer along the tubule (α=0.5). The stress and strain concentrations are also affected by the HL anisotropy as shown in figure 12. In section 1, the maximum major principal stress in the adhesive tag increases slightly as the HL anisotropy changes from α=0.5 to 2.0. We observe that the maximum major principal stress increase is comparable to the transverse stress, σxx, increase seen in the adhesive tag of the longitudinal model shown in figure 8 along section 1. The strain concentration factor shows a slight decrease as the HL anisotropy changes from α=0.5 to 2.0. On the other hand, in section 2 the maximum major principal stress in the peritubular dentin decreases as the HL anisotropy changes from α=0.5 to 2.0, albeit by a small amount. However, the strain concentration factor in the HL formed between the adhesive tag and the peritubular dentin of the lumen wall changes significantly with HL anisotropy.
Figure 12.
Effect of hybrid layer anisotropy on the maximum major principal stress and strain concentration in the transverse sections with the peritubular dentin kept isotropic.
4. Discussion
The premature failure of moderate to large composite restorations can be traced to a breakdown of the bond at the tooth surface-composite material interface (Collins et al. 1998; Mair 1998; Nordbo et al. 1998) and increased levels of the cariogenic bacteria, Streptococcus mutans, at the perimeter of these materials (Svanberg et al. 1990; Dunne et al. 1997). The breakdown of this bond has been linked to the failure of our current materials to consistently seal and adhere to the dentin (Meiers & Kresin 1996). Acid etching provides effective mechanical bonding between the composite restoration and treated enamel, but breakdown at the dentin surface continues to threaten the long-term viability of large posterior composite restorations (Dunne et al. 1997; Roulet 1997; Nordbo et al. 1998).
Current theories on dentin bonding suggest that two fundamental processes are involved in bonding an adhesive to dentin. First, the mineral phase must be extracted from the dentin substrate without altering the collagen matrix, and, second, the voids left by the mineral must be filled with adhesive resin that undergoes complete in situ polymerization (i.e. the formation of a resin-reinforced or HL). The ideal HL would be characterized as a three-dimensional collagen-resin biopolymer that provides both a continuous and stable link between the bulk adhesive and dentin substrate.
Using the micro-scale morphological, chemical and mechanical properties of d–a interfaces obtained from the confocal μRS and SAM, the authors have developed an FE model of the d–a interface. The results computed from the FE model indicate that the stress distributions and concentrations are affected by the micro-scale elastic properties of various phases composing the d–a interface. In this paper, a revised FE model is developed that accurately captures the micro-scale structure and mechanical properties. To gain insight into the relative influence of material anisotropy, and to keep the post-processing of the computational results tractable, two-dimensional FE models are considered. The FE models are designed to investigate micromechanical measurements for two sections of d–a interface—one along the axis of the tubules, and the other transverse to the axis of the tubules. The FE model of the d–a interface section along the tubules is utilized to investigate the effect of HL and dentin anisotropy. FE models of two different transverse sections are considered—one through the HL to study the effect of HL anisotropy, and the other through the dentin to study the effect of dentin anisotropy.
The two-dimensional FE calculations show that the stresses concentrate in two zones of the d–a interface: one zone that could lead to failure initiating within the ‘HL’, and the other zone that could lead to either ‘adhesive’ failure initiating in the ‘demineralized dentin–exposed collagen’ close to the dentin substrate or failure initiating in the dentin. The probable failure initiation sites predicted by these preliminary calculations seem similar to those determined by fractographic evaluations of conventional bond tests (Sano et al. 1994; Phrukkanon et al. 1999; Hashimoto et al. 2002; De Munck et al. 2003).
The FE models are also utilized to perform parametric studies of the effect of anisotropy on the stress and strain distributions within the dentin and the HL phases of the d–a interface. It is found that the anisotropy of the phases affects the region and extent of stress concentration as well as the location of the maximum stress concentrations. Thus, the anisotropy of the phases could effect the probable location of failure initiation, whether in the peritubular region or in the HL. For instance, the stress and strain distributions computed using the longitudinal FE model indicate that failure or fracture could probably initiate at three locations in the HL and the dentin: (i) in the adhesive tag proximal to the HL due to stress concentration; (ii) close to the bottom of HL due to high strains; and (iii) interface between the adhesive tag and peritubular dentin of the lumen wall due to stress concentrations.
Finally, we note that the two-dimensional models under simple loading conditions have been studied as a prelude to more complex three-dimensional modelling under general loading. These two-dimensional models provide a critical insight to the types of phenomena that may be expected in such complex systems. Based upon preliminary calculations performed by changing the intertubular spacing, we have observed similar stress concentration zones for coronal d–a interface. Further work is required to understand the variations in the d–a interface micromorphological and micromechanical properties. For instance, if the diameter of a tubule becomes wider in the demineralized dentin resulting in a conic geometry of the tubule, then we expect the degree of stress concentrations to change. However, the stress concentrations zones are probably the same. In addition, if the bond between the adhesive tags and peritubular dentin is imperfect, then the stress concentrations zones are probably within the HL and partially demineralized dentin. These two-dimensional models indicate the need to further refine the mechanical property measurements, including the anisotropic elastic moduli, Poisson's ratio and strength in regions of stress concentrations.
Acknowledgments
This research was partly supported by USPHS Research Grants DE12487 and DE14392, the National Institute of Dental and Craniofacial Research and a USPHS Major Instrumentation Grant RR16710 from the National Institute of Health.
Appendix A. Stress–strain relationship for transversely isotropic elastic materials.
| (A1) |
or
| (A2) |
The five independent constants of the stiffness matrix are given as
| (A3) |
Similarly, the five independent constants of the compliance matrix are given as
| (A4) |
References
- Achenbach J.D, Zhu H. Effect of interphases on micro and macromechnical behavior of hexagonal-array fiber composites. J. Appl. Mech. 1990;57:956–963. [Google Scholar]
- Collins C.J, Bryant R.W, Hodge K.L.V. A clinical evaluation of posterior composite resin restorations: 8-year findings. J. Dent. 1998;26:311–317. doi: 10.1016/s0300-5712(97)00019-5. [DOI] [PubMed] [Google Scholar]
- De Munck J, Van Meerbeek B, Yoshida Y, Inoue S, Vargas M, Suzuki K, Lambrechts P, Vanherle G. Four-year water degradation of total-etch adhesives bonded to dentin. J. Dent. Res. 2003;82:136–140. doi: 10.1177/154405910308200212. [DOI] [PubMed] [Google Scholar]
- Dunne S.M, Gainsford I.D, Wilson N.H.F. Current materials and techniques for direct restorations in posterior teeth. Part 1. Silver amalgam. Int. Dent. J. 1997;47:123–136. doi: 10.1002/j.1875-595x.1997.tb00777.x. [DOI] [PubMed] [Google Scholar]
- Eick J.D, Gwinnett A.J, Pashley D.H, Robinson S.J. Current concepts on adhesion to dentin. Crit. Rev. Oral. Biol. Med. 1997;8:306–335. doi: 10.1177/10454411970080030501. [DOI] [PubMed] [Google Scholar]
- Gwinnett A.J. Quantitative contribution of resin infiltration/hybridization to dentin bonding. Am. J. Dent. 1993;6:7–9. [PubMed] [Google Scholar]
- Hashimoto M, Ohno H, Sano H, Tay F.R, Kaga M, Kudou Y, Oguchi H, Araki Y, Kubota M. Micromorphological changes in resin-dentin bonds after 1 year of water storage. J. Biomed. Mater. Res. 2002;63B:306–311. doi: 10.1002/jbm.10208. [DOI] [PubMed] [Google Scholar]
- Inokoshi S, Nakaoki Y, Shono T, Pereira P.N.R, Yamada T, Tagami J. Collagen layer collapse and inhibited resin penetration by dentin etching. J. Dent. Res. 1996;75:389. abstract #2976. [Google Scholar]
- Katz J.L, Ukraincik K. On the anisotropic elastic properties of hydroxyapatite. J. Biomech. 1971;4:221–227. doi: 10.1016/0021-9290(71)90007-8. [DOI] [PubMed] [Google Scholar]
- Katz J.L, Bumrerraj S, Dreyfuss J, Wang Y, Spencer P. Micromechanics of the dentin/adhesive interface. J. Biomed. Mater. Res. Appl. Biomater. 2001;58B:366–371. doi: 10.1002/jbm.1030. [DOI] [PubMed] [Google Scholar]
- Katz J.L, Spencer P, Wang Y, Wagh A, Nomura T, Bumrerraj S. Structural, chemical and mechanical characterization of the dentin/adhesive interface. In: Lewandrowski K, Wise D, Trantolo D, Gresser J, Yaszemski M, Altobelli D, editors. Tissue engineering and biodegradable equivalents: scientific and clinical applications. Marcel Dekker; Basel: 2002. [Google Scholar]
- Katz J.L, Spencer P, Nomura T, Wagh A, Wang Y. Micromechanical properties of demineralized dentin collagen with and without adhesive infiltration. J. Biomed. Mat. Res. 2003;66A:120–128. doi: 10.1002/jbm.a.10551. [DOI] [PMC free article] [PubMed] [Google Scholar]
- Kinney J.H, Balooch M, Marshall G.W, Marshall S.J. A micromechanics model of the elastic properties of human dentine. Arch. Oral Biol. 1999;44:813–822. doi: 10.1016/s0003-9969(99)00080-1. [DOI] [PubMed] [Google Scholar]
- Kinney J.H, Oliveira J, Haupt D.L, Marshall G.W, Marshall S.J. The spatial arrangement of tubules in human dentin. J. Mater. Sci. Mater. Med. 2001;12:743–751. doi: 10.1023/a:1011232912734. [DOI] [PubMed] [Google Scholar]
- Kinney J.H, Marshall S.J, Marshall G.W. The mechanical properties of human dentin: a critical review and reevaluation of the dental literature. Crit. Rev. Oral Biol. Med. 2003;14:13–29. doi: 10.1177/154411130301400103. [DOI] [PubMed] [Google Scholar]
- Kinney J.H, Gladden J, Marshall G.W, Marshall S.J, So J.H, Maynard J.D. Resonant ultrasound spectroscopy measurements of the elastic constants in human dentin. J. Biomech. 2004;37:437–441. doi: 10.1016/j.jbiomech.2003.09.028. [DOI] [PubMed] [Google Scholar]
- Lee S.Y, Chiang H.C, Huang H.M, Shih Y.H, Chen H.C, Dong D.R, Lin C.T. Thermo-debonding mechanisms in dentin bonding systems using finite element analysis. Biomaterials. 2001;22:113–123. doi: 10.1016/s0142-9612(00)00086-7. [DOI] [PubMed] [Google Scholar]
- Lees S, Rollins F.R. Anisotropy in hard dental tissues. J. Biomech. 1972;5:557–566. doi: 10.1016/0021-9290(72)90027-9. [DOI] [PubMed] [Google Scholar]
- Lemor R.M, Wieliczka D.M, Kruger M.B, Swafford J.R, Spencer P. Spectroscopic and morphologic characterization of the dentin/adhesive interface. J. Biomed. Opt. 1999;4:22–27. doi: 10.1117/1.429917. [DOI] [PubMed] [Google Scholar]
- Mair L.H. Ten-year clinical assessment of three posterior resin composites and two amalgams. Quintessence Int. 1998;29:483–490. [PubMed] [Google Scholar]
- Marshall G.W, Marshall S.J, Kinney J.H, Balooch M. The dentin substrate: structure and properties related to bonding. J. Dent. 1997;25:441–458. doi: 10.1016/s0300-5712(96)00065-6. [DOI] [PubMed] [Google Scholar]
- Meiers J.C, Kresin J. Cavity disinfectants and dentin bonding. Oper. Dent. 1996;21:153–159. [PubMed] [Google Scholar]
- Misra A, Spencer P, Marangos O, Wang Y, Katz J.L. Micromechanical analysis of dentin/adhesive interface using finite element method. J. Biomed. Mater. Res. Appl. Biomater. 2004;70B:56–65. doi: 10.1002/jbm.b.30012. [DOI] [PMC free article] [PubMed] [Google Scholar]
- Nakabayashi N, Saimi Y. Bonding to intact dentin. J. Dent. Res. 1996;75:1706–1715. doi: 10.1177/00220345960750091401. [DOI] [PubMed] [Google Scholar]
- Nakabayashi N, Pashley D.H. Quintessence Publishing; Chicago, IL: 1998. Hybridization of dental hard tissues. [Google Scholar]
- Nordbo H, Leirskar J, von der Fehr F.R. Saucer-shaped cavity preparations for posterior approximal resin composite restorations: observations up to 10 years. Quintessence Int. 1998;29:5–11. [PubMed] [Google Scholar]
- Phrukkanon S, Burrow M.F, Tyas M.J. The effect of dentine location and tubule orientation on the bond strengths between resin and dentine. J. Dent. 1999;27:265–274. doi: 10.1016/s0300-5712(98)00060-8. [DOI] [PubMed] [Google Scholar]
- Roulet J.F. Benefits and disadvantages of tooth-coloured alternatives to amalgam. J. Dent. 1997;25:459–473. doi: 10.1016/s0300-5712(96)00066-8. [DOI] [PubMed] [Google Scholar]
- Sano H, Ciucchi B, Matthews W.G, Pashley D.H. Tensile properties of mineralized and demineralized human and bovine dentin. J. Dent. Res. 1994;73:1205–1211. doi: 10.1177/00220345940730061201. [DOI] [PubMed] [Google Scholar]
- Spencer P, Wang Y. Adhesive phase separation at the dentin interface under wet bonding conditions. J. Biomed. Mater. Res. 2002;62:447–456. doi: 10.1002/jbm.10364. [DOI] [PubMed] [Google Scholar]
- Spencer P, Wang Y, Walker M.P, Wieliczka D.M, Swafford J.R. Interfacial chemistry of the dentin/adhesive bond. J. Dent. Res. 2000;79:1458–1463. doi: 10.1177/00220345000790070501. [DOI] [PubMed] [Google Scholar]
- Svanberg M, Mjor I.A, Orstavik D. Mutans streptococci in plaque from margins of amalgam composite, and glass-ionomer restorations. J. Dent. Res. 1990;69:861–864. doi: 10.1177/00220345900690030601. [DOI] [PubMed] [Google Scholar]
- Tam L.E, Pilliar R.M. Fracture surface characterization of dentin-bonded interfacial fracture toughness specimens. J. Dent. Res. 1994;73:607–619. doi: 10.1177/00220345940730030601. [DOI] [PubMed] [Google Scholar]
- Wang Y, Spencer P. Quantifying adhesive penetration in adhesive/dentin interface using confocal raman microspectroscopy. J. Biomed. Mater. Res. 2002;59:46–55. doi: 10.1002/jbm.1215. [DOI] [PubMed] [Google Scholar]
- Wang Y, Spencer P. Overestimating hybrid layer quality polished in adhesive/dentin interfaces. J. Biomed. Mater. Res. 2004;68A:735–746. doi: 10.1002/jbm.a.20105. [DOI] [PubMed] [Google Scholar]
- Wieliczka D.M, Spencer P, Kruger M.B. Raman mapping of the dentin/adhesive interface. Appl. Spectrosc. 1996;50:1500–1504. [Google Scholar]
- Wieliczka D.M, Kruger M.B, Spencer P. Raman imaging of dental adhesive diffusion. Appl. Spectros. 1997;51:1593–1596. [Google Scholar]


