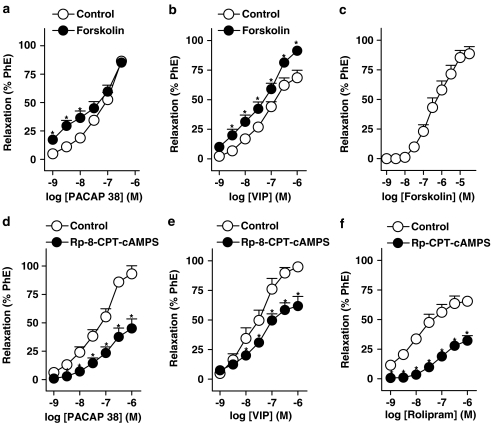
Figure 5.
Log concentration–response relaxation curves to (a, d) PACAP 38, (b, e) VIP, (c) forskolin and (f) rolipram in pig urinary bladder neck contracted by PhE (1 μM), in control conditions and in the presence of forskolin (30 nM) (a, b) or 8-(4-chlorophenylthio)adenosine-3′,5′-cyclic monophosphorothioate (Rp-8-CPT-cAMPS, 100 μM) (d–f). Relaxations are expressed as a percentage of the PhE-induced contraction. Results represent means and vertical lines s.e.m. of 6–7 preparations. *P<0.05 vs control value (paired t-test).

