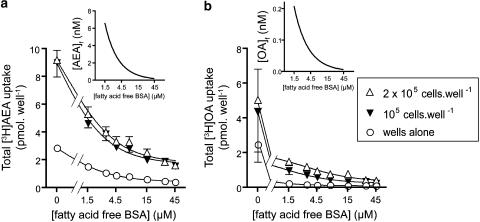
Figure 3.
Effect of the assay concentration of fatty acid-free BSA upon the observed rate of uptake of [3H]AEA (a) and [3H]OA (b) into ND7/23 cells. Values shown are means±s.e.m. (n=3). The added concentration of the substrate was 160 nM and the incubation time was 4 min at 37°C. The inserts show the theoretical free concentrations of AEA and OA, assuming interactions with BSA alone (Bojesen and Bojesen, 1994; Bojesen and Hansen, 2003).

