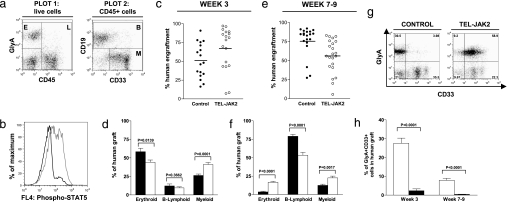
Fig. 2.
Characterization of the human graft in transplanted NOD/SCID mice. (a) Flow cytometric analysis of the BM of a representative TEL-JAK2 mouse at 3 weeks posttransplant (wpt). Plot 1, GlyA vs. CD45 analysis showing human erythroid cells (E, GlyA+CD45− cells) and human leukocytes (L, CD45+ cells). Plot 2, CD45+ cells analyzed for CD33 and CD19 expression, illustrating human B lymphoid cells (B, CD19+CD45+) and myeloid cells (M, CD33+CD19−CD45+). (b) Intracellular flow cytometry showing activation of STAT5 within the BM of a representative TEL-JAK2 mouse (gray line) vs. a control mouse (black line), at 3 wpt. Plot is gated on human CD45+ cells. (c and e) The percentage of human cells (sum of E and L from a) in the BM of control and TEL-JAK2 mice at 3 (c) and 7–9 (e) wpt. Each circle represents an individual mouse, and the mean is indicated by a line. (d and f) The percentages of erythroid, B lymphoid, and myeloid cells (as defined in a) within the human graft of control (black bars) and TEL-JAK2 (white bars) mice at 3 (d) and 7–9 (f) wpt. (g) Expression of GlyA and CD33 on human cells in the BM of transplanted mice at 3 wpt. (h) Proportion of cells coexpressing GlyA and CD33 (corresponding to the top right quadrant of g) within the human graft of control and TEL-JAK2 mice. Errors bars in d, f, and h indicate SEM; for 3 wpt, n = 17 for control, n = 18 for TEL-JAK2; for 7–9 wpt, n = 20 for control, n = 21 for TEL-JAK2.

