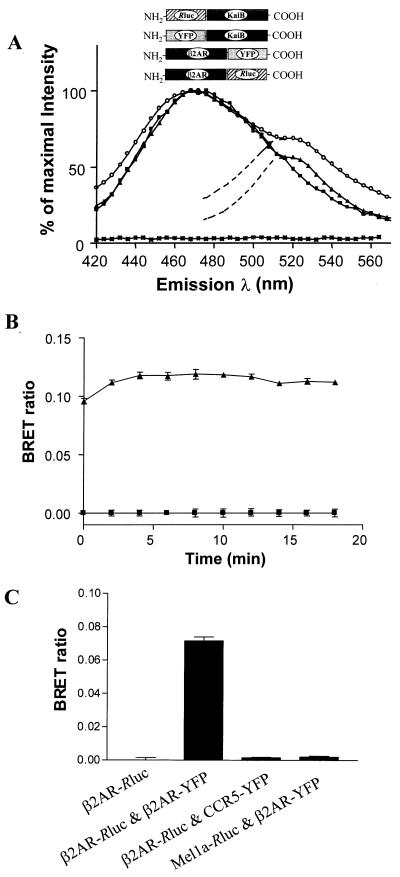
Figure 2.
BRET in living HEK-293 cells expressing β2AR-YFP and β2AR-Rluc. (A) HEK-293 cells expressing β2AR-YFP (asterisks), β2AR-Rluc (■), or coexpressing β2AR-YFP and β2AR-Rluc (▴) or KAIB-YFP and KAIB-Rluc (○) were incubated with 5 μM coelenterazine h (Molecular Probes), and light-emission acquisition was performed immediately. All spectra were normalized as percentage of maximal emission. The spectra shown are representative of four independent experiments. (B) Luminescence and fluorescence signals were quantitated by using a BretCount (Packard), allowing the sequential integration of the signals detected in the 440- to 500-nm and 510- to 590-nm windows. The BRET ratio was defined as [(emission at 510–590) − (emission at 440–500) × Cf]/(emission at 440–500), where Cf corresponded to (emission at 510–590)/(emission at 440–500) for the β2AR-Rluc expressed alone in the same experiments. Readings were started immediately after coelenterazine addition, and repeated measures were taken for ≈20 min. The data shown represent the mean ± SEM of four independent readings. (C) To assess the specificity of interaction, BRET ratios were measured in cells coexpressing β2AR-Rluc and β2-YFP together or individually with either CCR5-YFP and Mel1a-Rluc, respectively.

