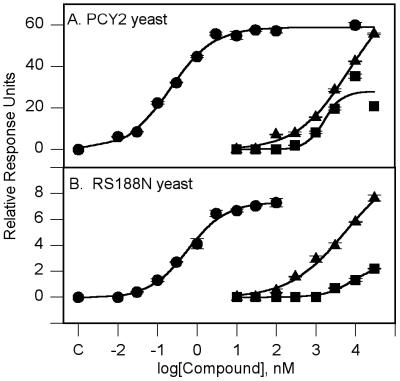
Figure 1.
Dose response for E2, tamoxifen, and ICI 182,780. (A) PCY2 yeast. (B) RS188N yeast. The figure is representative of three to four independent experiments. The points shown are means ± SEM. The curves areas follows: E2 (●), ICI 182,780 (▴), and tamoxifen (■). Point C is the response in the absence of added E2.

