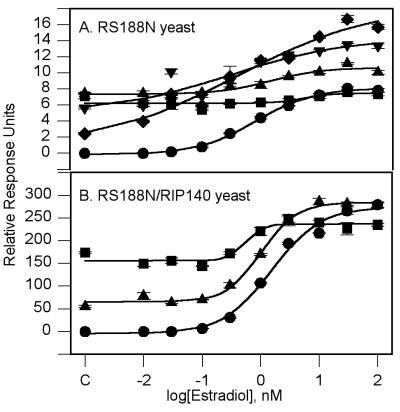
Figure 2.
Effect of antiestrogens on E2 dose response. (A) RS188N yeast. The curves are as follows: E2 (●); + ICI 182,780: 0.3 μM (♦), 1.0 μM (▾), 3.0 μM (▴), and 10 μM (■). (B) RS188N/RIP140 yeast. The curves are as follows: E2 (●); + 10.0 μM ICI 182,780 (▴) or + 10.0 μM tamoxifen (■). Point C is the response in the absence of added E2. The values shown are means ± SEM from a single experiment.

