
Figure 2.
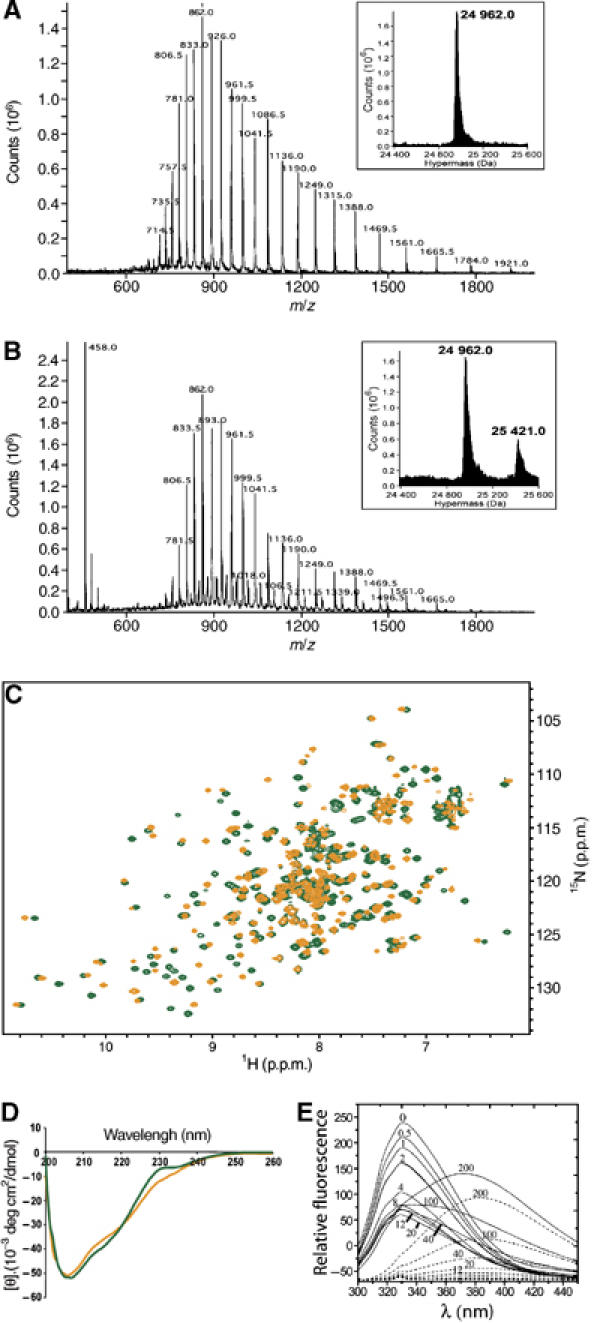
Mass spectrum of the apo- (A) and m7GDP-bound (B) forms of wild-type eIF4E. ES-MS spectra plotting ion abundance as a function of the mass/charge ratio. Insets: hypermass reconstruction of the spectrum. The low molecular weight peak at 458 is consistent with the presence of the m7GDP (457.23 Da). For more details, see figure legend in Supplementary Figure 3. Clearly, no cap-bound eIF4E is present in the apo sample. (C) Superposition of the 1H-15N HSQC spectrum of the apo-eIF4E (orange) and the m7GDP-bound eIF4E (green). (D) The far-UV CD spectra of apo-eIF4E (orange) and m7GDP–eIF4E (green). (E) Fluorescence emission of wild-type eIF4E in the presence of increasing concentrations of m7GDP (continuous) and intrinsic fluorescence of m7GDP in the absence of eIF4E (dashed). The different m7GDP concentrations (μM) are shown on the curves and fit is shown in Supplementary Figure 2.