
Figure 2.
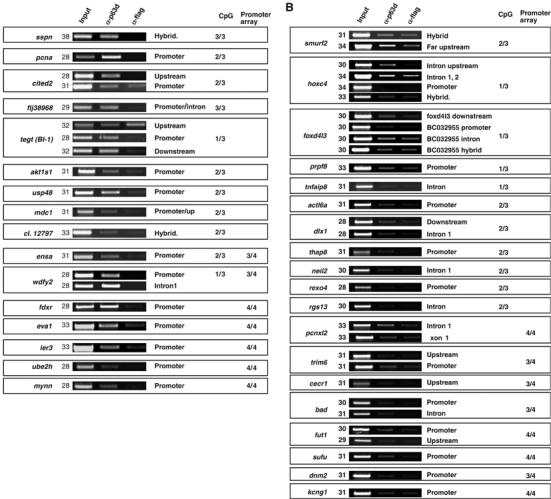
Validation of the loci from the screening. ChIP of HaCaT cells with α-p63 (middle lanes) and control α-Flag (right lanes) antibodies. (A) Displays the loci highly enriched, whereas (B) displays those weakly bound by p63. For each locus, the position of the primer set is indicated on the right (see Supplementary Figures 1 and 2 for a schematic representation). Numbers on the left refer to the PCR cycles. The numbers on the right side indicate the number of times the locus has been found positive in the CpG islands experiments (CpG), or in the promoter arrays. ensa and wdfy2 were scored in both platforms.