
Figure 3.
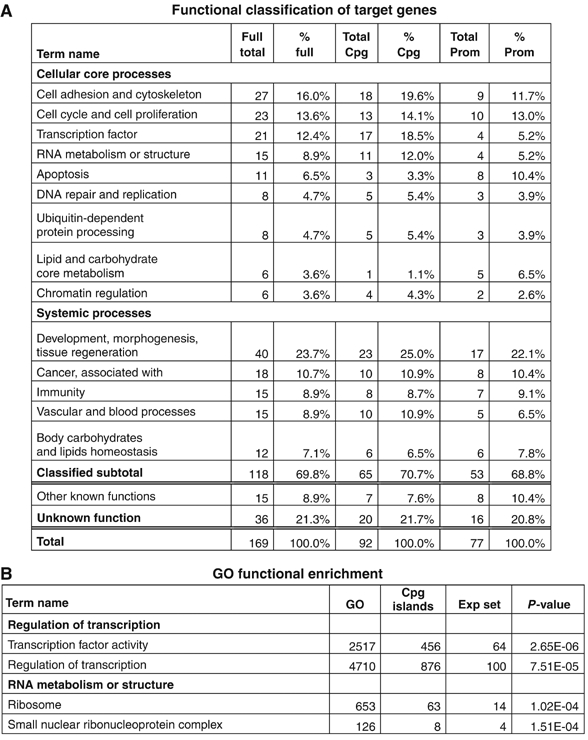
Functional classification of the genes. (A) Functional categories manually assigned to each gene from both the lists of CpG (2/3 positives) and promoters (3/4 positives), according to the annotation of NCBI EntrezGene. The columns show the total number of genes assigned to each category (full total), the percentage over the total number of genes (% full) and the relative number and percentages for each list (CpG or promoter). Note that 20% of genes remain unclassified. (B) Summarizes the results of the statistical GO functional enrichment obtained with the full nonredundant list of genes from all three CpG islands experiments. GO indicates the term number in the Gene Ontology library; CpG islands, the term number of the entire CpG island library (data obtained from http://derlab.med.utoronto.ca/CpGIslands.htm); Exp set refers to the term number in the list of positive clones and P-value indicates the statistical enrichment.