
Figure 6.
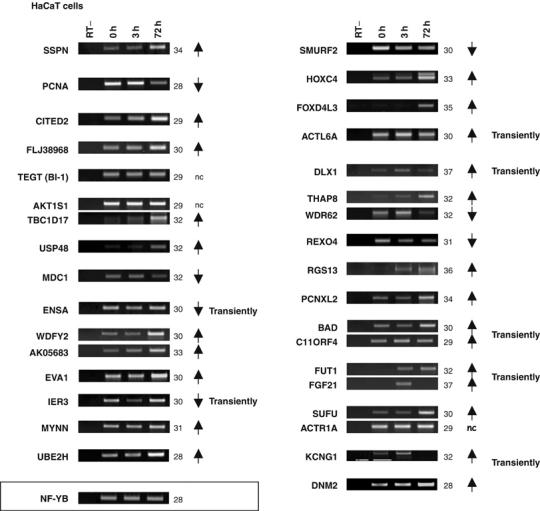
Expression analysis in HaCaT cells. RT–PCR of the target genes, displayed in the same order as in Figures 2 and 4, with RNA extracted from HaCaT cells, treated with 1.4 mM CaCl2 for the indicated times: 0 h (lane2), 3 h (lane3) and 72 h (lane 4). Lane 1 represents the control with RNA (0 h) without reverse transcriptase (RT−). For each gene, the PCR cycles are indicated; arrows indicate the direction of change; NC, no change. Genes belonging to the same locus are grouped together. The cDNAs were normalized to NF-YB expression.