
Figure 1.
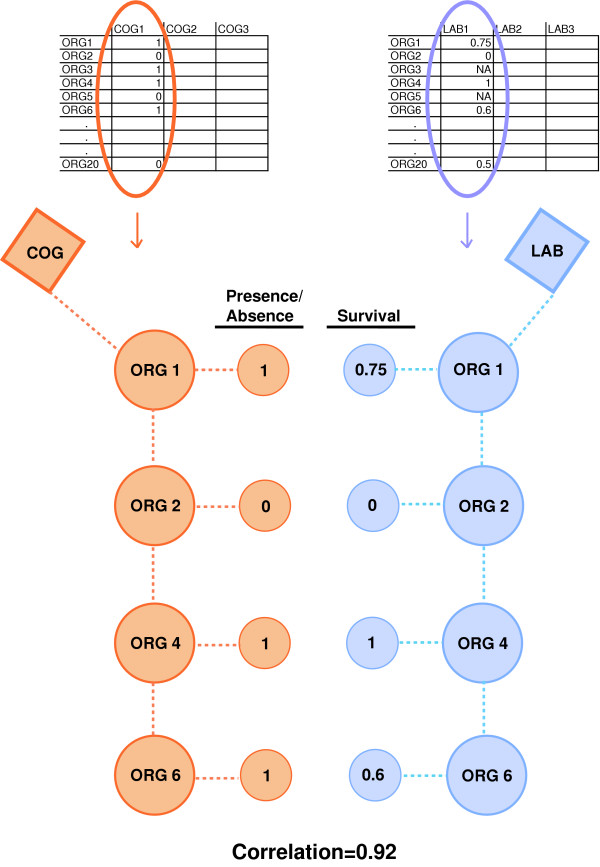
Diagram of correlation analysis for associating COGs to lab condition phenotypes. The correlation analysis measures the association between a COG's organism profile (presence or absence of an organism) and a lab condition's organism survival profile. Organisms that have a COG (red) are mapped to the organism's response to adverse growth conditions (blue) creating two vectors that are used for the correlation calculation.