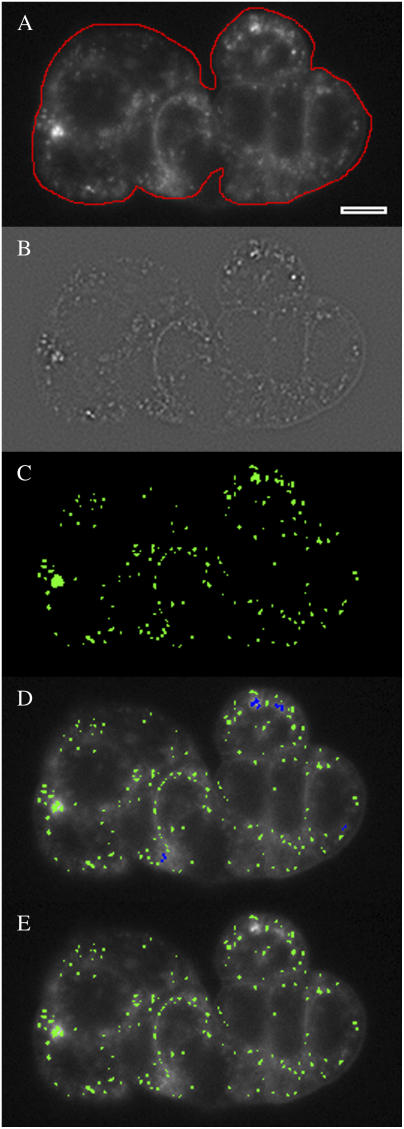
FIGURE 3.
Image-processing steps to identify internalized FM 1-43 labeled particles. (A) An ROI (in red) is manually drawn around the cluster perimeter; only particles inside the ROI will be considered. (B) A Laplacian filter and smoothing filter are applied to the image to highlight intensity gradients (Materials and Methods), generating a new image. (C) A binary map (in green) is generated by tagging pixels in the gradient image with values above a fixed threshold. (D) Tagged pixels in the map are marked (blue) then removed if they are overly elongated with respect to their width (to eliminate nonpunctate tags). (E) Pixels in the original image that lie under the map (green) are analyzed for frequency and area.

