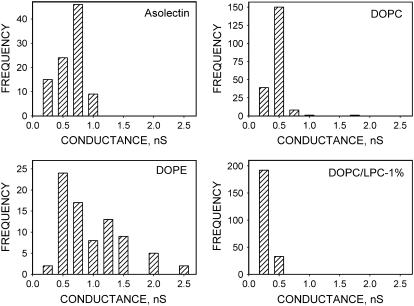
FIGURE 3.
Amplitude histograms of single-channel conductance induced by α-HlyA in membranes of various lipid composition: asolectin, DOPC, DOPE, and DOPC/LPC, 1%. Each histogram represents channels with lifetimes longer than 0.1 s collected from several experimental recordings before the record become noisy. Bathing solution contains 150 mM NaCl, 10 mM HEPES, pH 7.4. Potential on membrane +50 mV.

