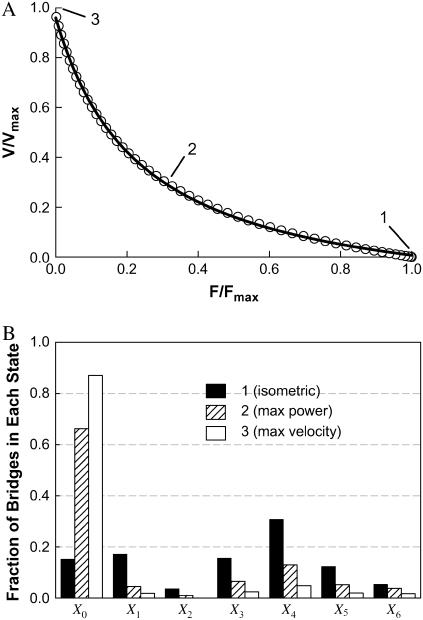
FIGURE 3.
Simulated force-velocity relationship (open circles, data generated by model) fitted with a hyperbolic curve (A). See text for fitting parameters. Snapshots of fractions of cross-bridges occupying each state at zero (1), medium (2), and maximum (3) shortening velocity (corresponding respectively to conditions where isometric force, maximum power, and maximum velocity are generated) are shown in panel B. The value Xi corresponds to states indicated in Fig. 1.

