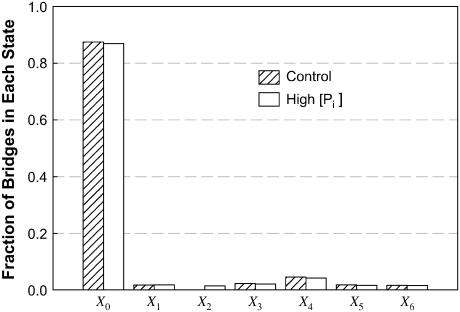
FIGURE 8.
Fraction of cross-bridges occupying each state at maximal velocity of shortening. Although X2 under conditions mimicking ↑[Pi ] is more than four-times greater than that of the control (too small to be seen on the graph), the overall distribution of the bridges in other states is largely unaffected by the partial blockade of the transition between State 2 and State 3 at maximal velocity of shortening.

