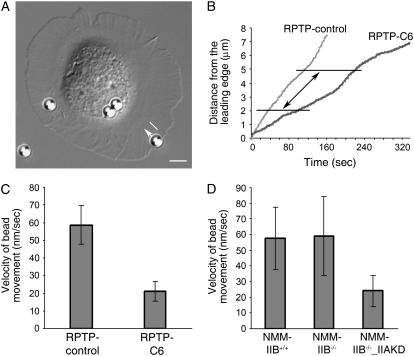
FIGURE 4.
Retrograde F-actin flow is driven by NMM-IIA, not NMM-IIB. (A) A differential interference contrast image taken from a time-lapse movie of fibronectin-coated 2.7-μm magnetic beads transported on the surface of a MEF cell. White arrow depicts the centripetal direction of bead movement. The white line fragment in parallel to the white arrow spans a 3.0-μm-wide region used to analyze the velocity of bead movement. Scale bar, 5 μm. (B) Representative beads transported on control MEF cells (RPTP-control) and NMM-IIA-knockdown MEF cells (RPTP-C6) cells were sampled, and the distance from the center of the beads to the leading edge of the cell was plotted versus time. The fragments of the traces between the two horizontal lines (3.0 μm apart, as indicated by the double-headed arrow) correspond to the travel distance of beads as depicted by the white line fragment in panel A. (C) Average velocity of bead movement on RPTP-control cells and RPTP-C6 cells. t-test, P < 0.001. (D) Bead movement rate is similar on NMM-IIB+/+ cells and NMM-IIB−/− cells. Average velocity of bead movement on NMM-IIB−/−_IIAKD cells is significantly slower than on NMM-IIB+/+ cells and NMM-IIB−/− cells (untransfected cells or cells transfected with control plasmid). t-test, P < 0.001. Error bars show mean ± SD.

