FIGURE 5.
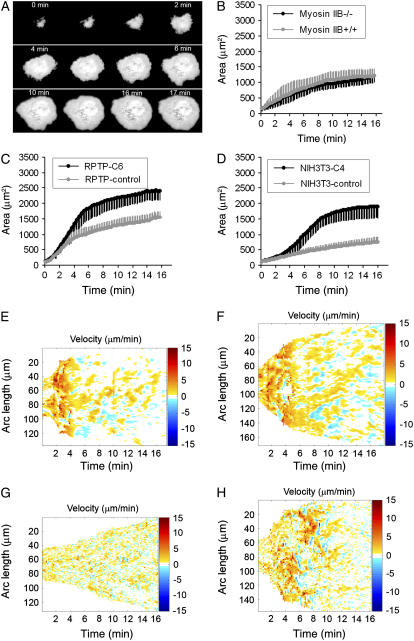
NMM-IIA regulates cell spreading of mouse embryonic fibroblasts. (A) Sequential TIRF images of a Calcein AM-labeled MEF cell spreading on fibronectin substrate. Panels B, C, and D are plots of cell area over a course of time. NMM-IIB+/+ and NMM-IIB−/− cells spread to similar areas on fibronectin substrate at early times (within 16 min) (B); RPTP-C6 cells spread significantly faster than RPTP-control cells (C); NIH3T3-C4 cells spread significantly faster than NIH3T3-control cells (D). Error bars show standard deviation. (E–H) are velocity maps as given by plotting velocity of protrusion/retraction of points at cell edge as a function of time and arc length (length of entire cell edge) that were obtained by analyzing 10-s interval time-lapse TIRF images of Calcein-AM labeled cells spreading on fibronectin at 37°C. Briefly, time-lapse image sequences were analyzed with Matlab to obtain a closed curve delineating the cell edge, which was then parameterized by arc length. For each point on the cell boundary in each frame of time-lapse sequential images, the normal velocity was calculated and displayed in color-coded plots. Points on the cell boundary are specified by time (in minutes) and arc length (in μm); red coloring represents protrusion events, whereas blue represents retraction events as depicted by the velocity bars. Velocities with an absolute value <0.5 μm/min were not considered to be relevant events. They are reflected as colorless patches among red and blue patches. Details are described in Materials and Methods section. Panels E, F, G, and H are representative samples of RPTP-control, RPTP-C6, NIH3T3-control, and NIH3T3-C4 cells, respectively.

