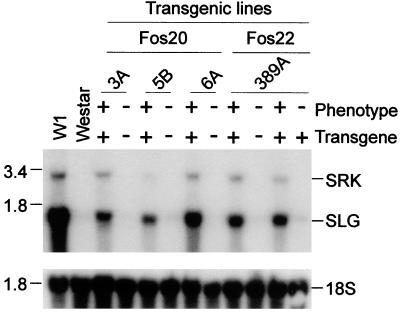
Figure 4.
Expression of the SLG and SRK transgenes in the stigmas of the T1 progeny plants. Sources of stigma tissues are indicated above each lane (the last lane is 389A-5). “+” indicates presence of the transgene; “−” indicates loss of the transgene caused by segregation. The blot was probed with SLG-910 and SRK-910 cDNAs. “Phenotype” indicates the gain-of-function SI phenotype in the stigmas. Molecular size markers are indicated at left in kilobases. (Lower) Rehybridization of the same blot to 18S rDNA.

