. 2006 Oct 18;5:46. doi: 10.1186/1476-072X-5-46

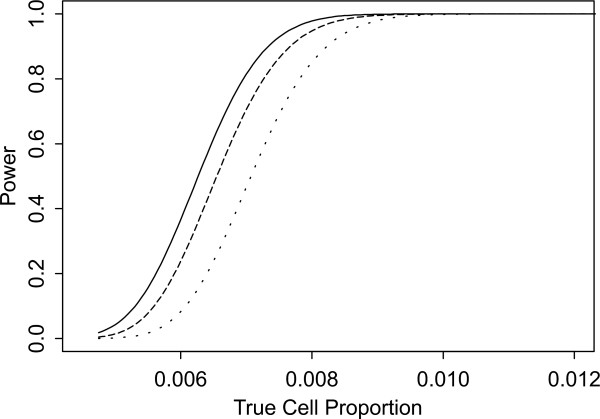
Figure 10.

Figure 10

Power for each method by true cell proportion (θ) when the overall proportion (μ) is 5/1000 and the cell population size (ni+) is 10000, when R1 and R2 are satisfied. The solid lines represents the BN method when the cluster size ki = P MathType@MTEF@5@5@+=feaafiart1ev1aaatCvAUfKttLearuWrP9MDH5MBPbIqV92AaeXatLxBI9gBamrtHrhAL1wy0L2yHvtyaeHbnfgDOvwBHrxAJfwnaebbnrfifHhDYfgasaacH8akY=wiFfYdH8Gipec8Eeeu0xXdbba9frFj0=OqFfea0dXdd9vqai=hGuQ8kuc9pgc9s8qqaq=dirpe0xb9q8qiLsFr0=vr0=vr0dc8meaabaqaciaacaGaaeqabaWaaeGaeaaakeGabaaUrGqaciab=bfaqbaa@385B@α(λ^ MathType@MTEF@5@5@+=feaafiart1ev1aaatCvAUfKttLearuWrP9MDH5MBPbIqV92AaeXatLxBI9gBaebbnrfifHhDYfgasaacH8akY=wiFfYdH8Gipec8Eeeu0xXdbba9frFj0=OqFfea0dXdd9vqai=hGuQ8kuc9pgc9s8qqaq=dirpe0xb9q8qiLsFr0=vr0=vr0dc8meaabaqaciaacaGaaeqabaqabeGadaaakeaaiiGacuWF7oaBgaqcaaaa@2E77@i:0) + 1. The dashed and dotted lines represent the CI method when the observed cell proportions (ci+/ni+) are ki/ni+ and ki/ni+ + c++/n++, respectively.