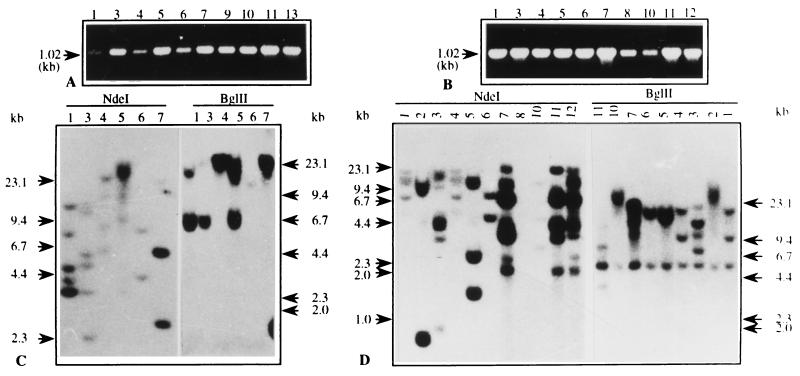
Figure 2.
PCR amplification of genomic DNA from pSB8 (A) and pSB8G (B) plantlets. The amplification products and their size are indicated by arrow. The primers and their positions are shown in Fig. 1. In Southern blot analysis, 15 μg of DNA from each transgenic lines of pSB8 (C) and pSB8G (D) was digested with BglII and NdeI and resolved on a 0.7% agarose gel. Digested products were transferred onto GeneScreenPlus membrane and hybridized with 32P-labeled full-length AmA1 cDNA as shown in Fig. 1. Numbers on the lanes are representatives of independent transgenic lines.

