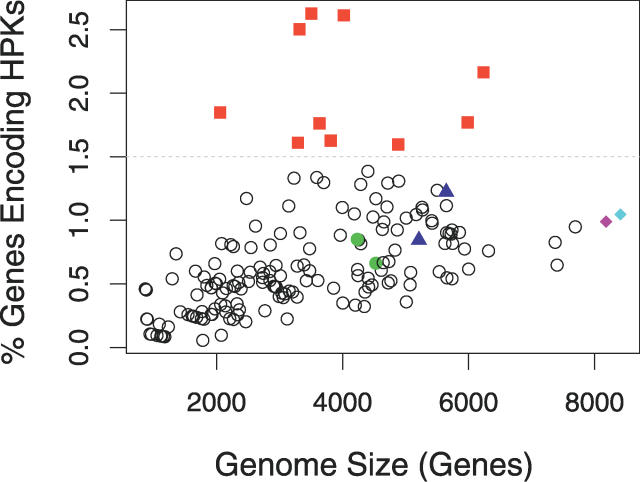
Figure 2. HPK Content versus Genome Size.
The percent of each genome is plotted as a function of genome size. As reported in previous studies, there is a roughly linear correlation. Highlighted in colored symbols are several groups of genomes described in the text: genomes coding a high (≥1.5%) fraction of HPKs—red squares; the model organisms, E. coli and B. subtilis—green circles; genomes with a high number of HGT events—blue triangles; Bradyrhizobium japonicum (high number of both HGT and LSE genes)—pink diamond; and Streptomyces coelicolor (high percentage of LSE genes)— turquoise diamond.

