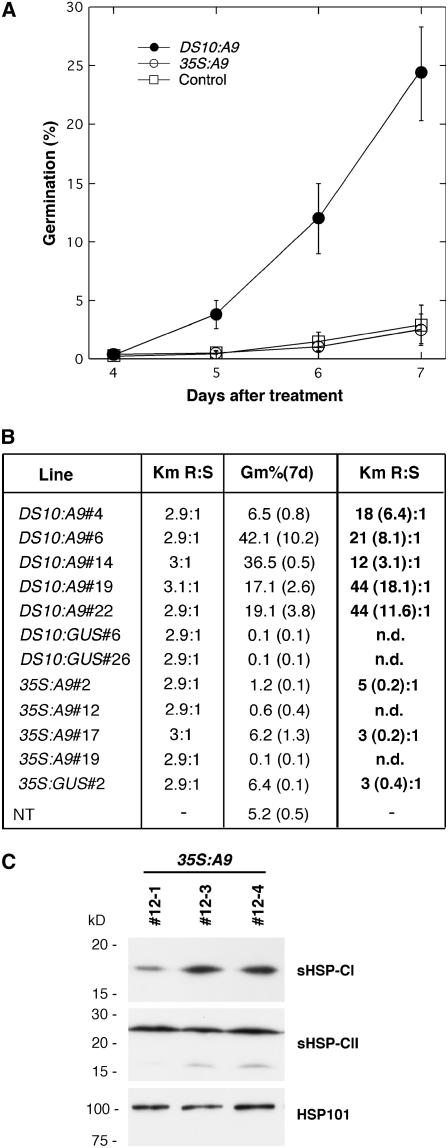
Figure 3.
Germination following basal thermotolerance assays is linked to DS10:A9 transgene inheritance in first-generation transgenic seeds. A, Germination percentage observed at various times after a 50°C treatment for 4 h. Each time point represents average values obtained for DS10:A9, 35S:A9, and other control (NT, 35S:GUS, and DS10:GUS) seeds from the lines listed in B. Such lines contain each transgene in heterozygosis and integrated at a different single locus. The experiments were repeated at least twice. B, Table summarizing the germination percentage 7 d after transfer to germination conditions for the individual lines [Gm%(7 d)]. The transgene segregation data obtained before and after treatment at 50°C also are summarized. The segregation is expressed as the ratio (R:S) between seedling numbers that were resistant (R) or sensitive (S) to kanamycin (Km). The numbers and lettering in bold correspond to the transgene segregation after the 50°C treatment. The numbers in parentheses represent the se for the germination data. Segregation was not determined (n.d.) when there were insufficient germinated seeds. C, Minor effects of the 35S:A9 transgene on HSP accumulation in seeds. Examples from sibling homozygous lines with (35S:A9#12-3, 35S:A9#12-4) or without (35S:A9#12-1) the transgene are presented. The rest of the symbols are as in Figure 1A.

