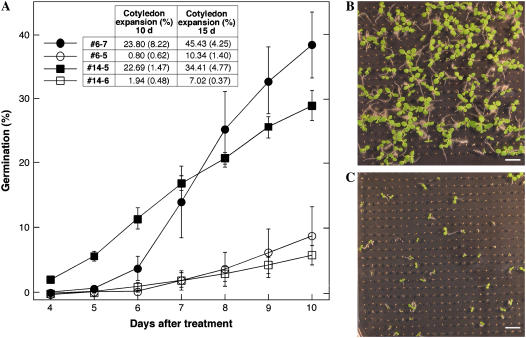
Figure 4.
Persistence of basal thermotolerance in imbibed second-generation transgenic DS10:A9 seeds. A, The germination percentage observed at various times after the 50°C treatment and the percentage of expanded cotyledons observed at the two time points analyzed are represented. Samples were seeds from the same lines as in Figure 1, and transgenic lines contained the transgene in homozygosis and integrated at a different single locus. Each transgenic sample is compared to the corresponding nontransgenic sibling sample. The error bars or numbers represent the se (inset table, in parentheses). B and C, Pictures are examples of the differences in germination and growth observed with the transgenic #6-7 (B) and nontransgenic #6-5 (C) seeds, 15 d after the 50°C treatment. Scale bars = 1 cm.

