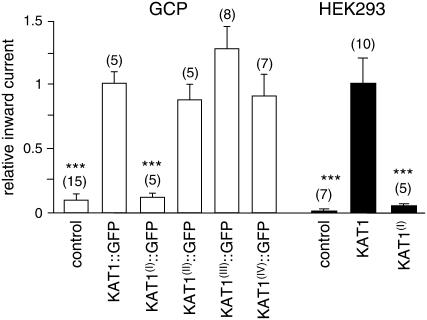
Figure 2.
Comparison of average steady-state inward currents. Currents were measured at 2160 mV (guard cell protoplasts [GCP]) or 2140 mV (HEK293 cells) in untransfected cells (control) and cells expressing KAT1 or KAT1 mutants (as indicated below bars). Average steady-state currents were normalized to the current recorded in cells expressing wild-type KAT1. Numbers of independent experiments are given in parentheses. Error bars correspond to mean ± SEM. Asterisks indicate significant differences compared to cells transfected with wild-type KAT1 (***, P < 0.005; Student's t test).

