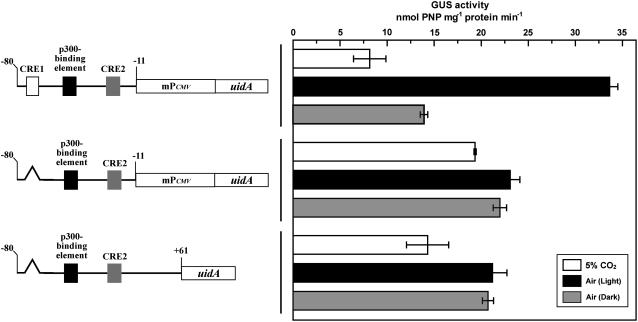
Figure 8.
Activities of the intact or the CRE1-deleted Pptca1 during acclimation from 5% CO2 to air under illumination or in the dark. The left and the right halves indicate constructs and GUS activities, respectively. Top, A transformant with the construct L shown in Figure 4; middle, a transformant with the construct M shown in Figure 4; bottom, a transformant with the construct B shown in Figure 3. The 5% CO2-grown cells (white bars) were transferred to air and were allowed to acclimate to air in the light (black bars) or the dark (gray bars) for 1 d. Deleted portions are indicated as broken lines. Values are means ± sd of three separate experiments.

