Figure 2.
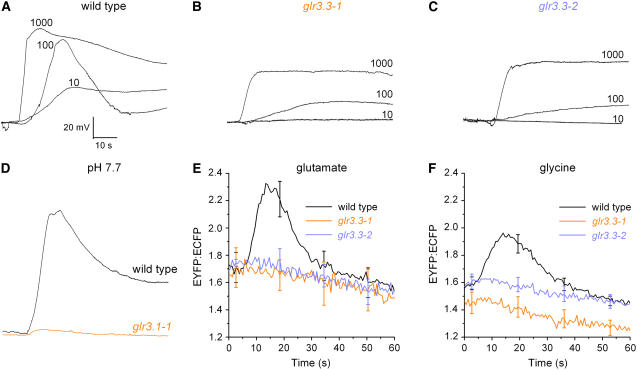
Comparison of ionic responses induced by Glu in roots of wild type and glr mutants. A, Depolarizations increased in magnitude and changed shape as Glu concentration was increased from 10 to 1,000 μm in the wild type. The external medium was pH 5.7. B, Responses of glr3.3-1 to 10 μm Glu were not detectable. A sustained depolarization was induced in the mutant by Glu concentrations at or greater than 100 μm. C, The dependence of the depolarization on GLR3.3 is confirmed with the independent glr3.3-2 allele. D, At pH 7.7, the wild-type response to 1,000 μm Glu (black) was large and the mutant response was nearly absent (red). All membrane potential traces shown are representative of between three and nine independent trials. Average peak responses are stated in the text. E, The change in cytoplasmic Ca2+ induced by 1,000 μm Glu in the wild type (n = 12) was abolished in two independent glr3.3 mutant alleles (n = 6, 7). F, The change in cytoplasmic Ca2+ induced by 1,000 μm Gly in the wild type (n = 12) was absent in two independent glr3.3 mutant alleles (n = 7, 8).

