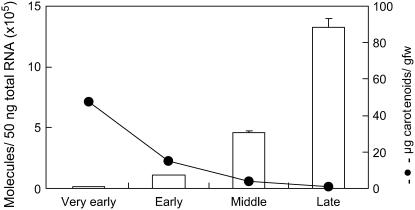
Figure 4.
Changes in carotenoid concentrations (black circles) and CmCCD4a transcript levels (bars) during flower petal development of Paragon. Quantitative real-time RT-PCR analysis was performed in triplicate using CmCCD4a-specific primers, and the expression levels were normalized against actin levels; mean values ± se are shown.

