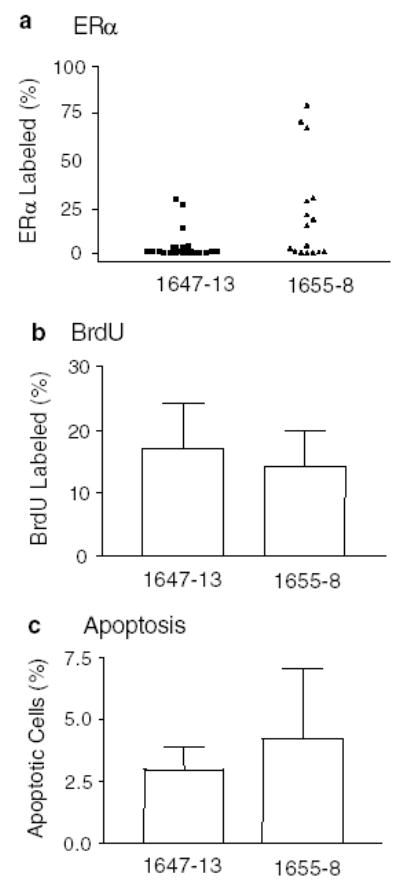
Figure 4.

(a) Proportion of ERα+ cells in adenocarcinomas in NRL-PRL 1647-13 (▴), and NRL-PRL 1655-8 virgin females (▪). Each symbol represents a single tumor (N=23 for NRL-PRL 1647-13, and 16 for NRL-PRL 1655-8). The distribution of tumors is close to significantly different between the lines using the Mann–Whitney test (P=0.06). Proliferation (b) and apoptosis (c) in mammary tumors (N=6 tumors for NRL-PRL 1655-8; N=7 for NRL-PRL 1647-13). BrdU labeling and apoptotic indices were determined as described in Materials and methods, and expressed as means±s.d. The lineages were not significantly different
