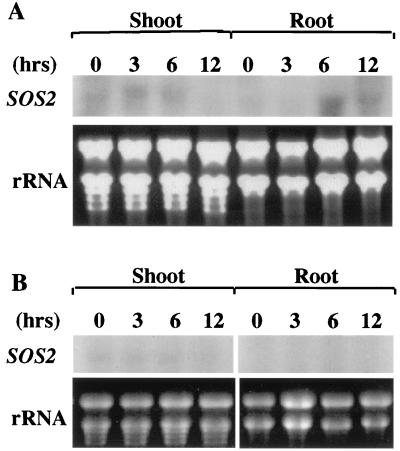
Figure 5.
Regulation of SOS2 expression by salt stress. Plants were treated with 200 mM NaCl (A) or with nutrient solution as a control (B) for the indicated time periods. Total RNA were extracted from roots and shoots, and subjected to Northern blot analysis with 32P-labeled SOS2 cDNA as probe. Thirty-five micrograms of total RNA was loaded in each lane. Ethidium bromide-stained rRNA bands were used as controls for equal loading.

