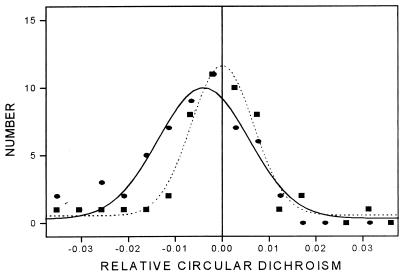
Figure 3.
Distribution of the CD data for the crystalline phase of the complex tris(1,2-ethanediamine)iridium(III). Points represent the measured values; lines are fitted Gaussians. Dotted line: tri-distilled water; solid line: precipitated crystalline material. The CD data are given in relation to those for the pure enantiomer: Δɛ = 0.95 cm−1⋅M−1 at the measuring wavelength of 270 nm. The fitted values are: shift for the crystalline material Sc = −(39 ± 8) × 10−4, Wc = (191 ± 19) × 10−4; for tri-distilled water Sw = (0.3 ± 5) × 10−4, Ww = (131 ± 11) × 10−4, and from these the calculated values S = −(39 ± 9) × 10−4, width W = (140 ± 21) × 10−4. The negative shift corresponds to surplus of the (+) enantiomer.

