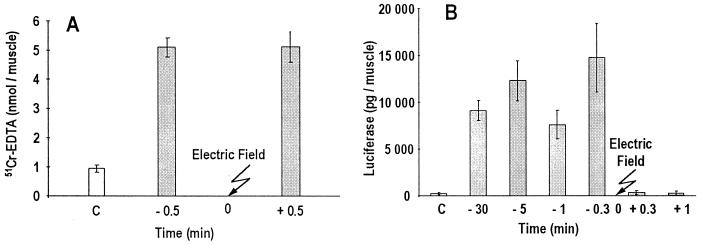
Figure 3.
Comparative effect of the time of injection vs. time of electric-pulse delivery on the in vivo 51Cr-EDTA uptake and on luciferase gene expression by muscle fibers. Bars represent the mean of the individuals values; error bars represent SEM. Gray bars represent the uptake of 51Cr-EDTA (A) or the uptake of plasmid DNA (B) as assessed by luciferase gene expression 7 days after the electric pulses (eight pulses; 200 V/cm; 20 ms per pulse; 1 Hz). White bars represent control values observed in the absence of electric pulses.

