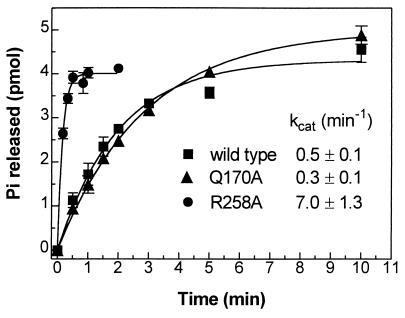
Figure 3.
Single turnover GTP hydrolysis rate of purified αs isoforms. GTP hydrolysis of αs-WT (■), αs-Q170A (▴), and αs-R258A (●) at 0°C is shown as the amount of phosphate (Pi) released as a function of time. The calculated catalytic rates (kcat) also are shown. Each data point represents the mean ± SE of three experiments. Baseline counts at time zero ranged from 30 to 55% of maximum counts released. The majority of baseline counts is attributable to free inorganic phosphate contamination of the stock [32P-γ]GTP.

