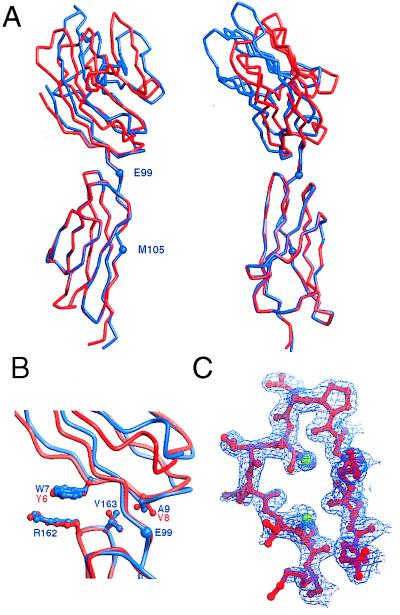
Figure 2.
The structure of cCD58. (A) Two orthogonal views of schematic α-carbon representations of cCD58 (red) and rat sCD2 (blue), superimposed on domain 2 of each molecule. Residues E99 and M105 at the boundaries of the linker region of rat CD2 domain 2 are marked with blue spheres. (B) The interdomain region is shown enlarged with the sidechains of the key nonlinker interface residues of cCD58 (red) and CD2 (blue) drawn as ball-and-stick models. (C) Portion of the 2Fo − Fc electron density map (final model phases) contoured at 1σ in the region of the FG loop of domain 1 of CD58. Running from right to left, residues 76–87 are shown in ball and stick representation and are colored red. The green spheres represent modeled water.

