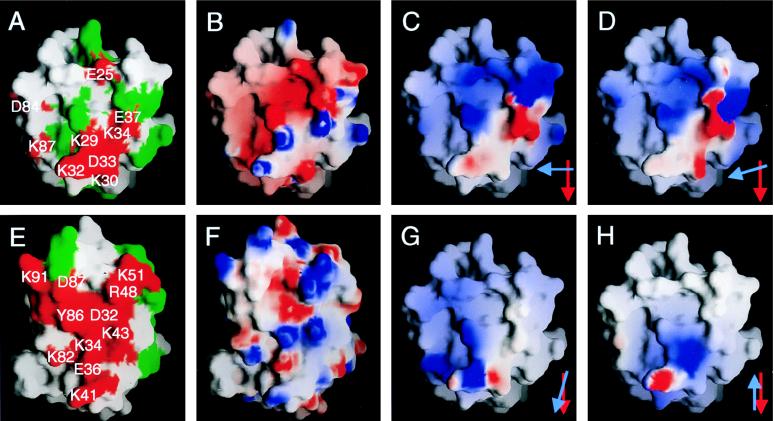
Figure 4.
Properties of the ligand binding faces of CD58 (A–D, G, and H) and human CD2 (E and F) viewed as in Fig. 3 A and B, respectively. In A and E, the grasp (22) surfaces of residues whose mutation disrupts or has no effect on binding are colored red and are labeled or are colored green, respectively (only a subset of the mutated human CD2 residues are labeled in E for clarity). In B and F, the electrostatic potential calculated at neutral pH is shown projected onto the grasp surfaces of the two domains; blue represents positive potential, white represents neutral, and red represents negative potential contoured at ±8.5 kT. In C, D, G, and H, the electrostatic potential of the ligand binding surface of human CD2, contoured at ±2.5 kT after docking with CD58, is shown projected onto the grasp surface of CD58 domain 1. The models used to dock the proteins are the homodimeric human sCD2 (9) (C) and rat sCD2 [molecule 2 of the asymmetric unit (8) (D)] crystal lattice contacts, the homodimeric interaction of CD8 monomers (27) (G), and the putative, membrane-spanning homodimeric interaction of P0 monomers (28) (H). Red and blue arrows in the lower right hand corners of C, D, G, and H indicate the relative orientations of the C β-strands of the domain 1 AGFCC′C′′ sheets of CD58 and CD2, respectively, in each of the four model complexes. In C and D, the projected electrostatic surface of CD2 is highly complementary to that of CD58 shown in B.

