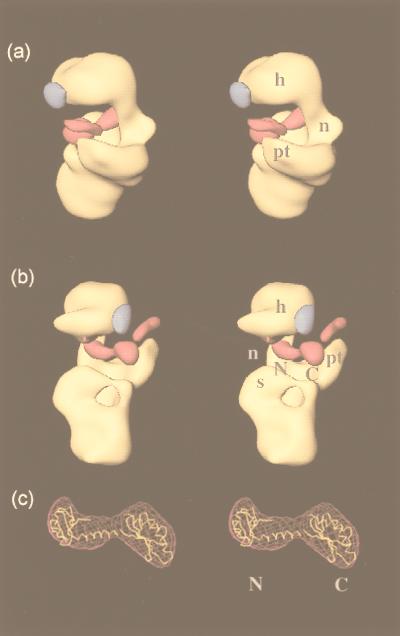
Figure 3.
Stereo views of a 27-Å cryo-EM reconstruction of the 30S subunit bound to IF3. The positive (magenta) and negative (blue) difference densities on IF3 binding are overlaid on the three-dimensional cryo-EM map of the native 30S subunit (yellow). The labels on the 30S subunit indicate the head (h), neck (n), shoulder (s), and platform (pt). The two lobes of positive difference density that we have assigned to the N- and C-terminal domains of IF3 are labeled N and C, respectively. (a) View from the platform side, with the 50S subunit interface on the left; (b) the same structure viewed from the shoulder side, with the 50S subunit interface on the right; (c) the best fit of the x-ray crystal structure of IF3 into the corresponding difference density, with the N- and C-terminal domains indicated by the appropriate letters.

